FIGURE 3.
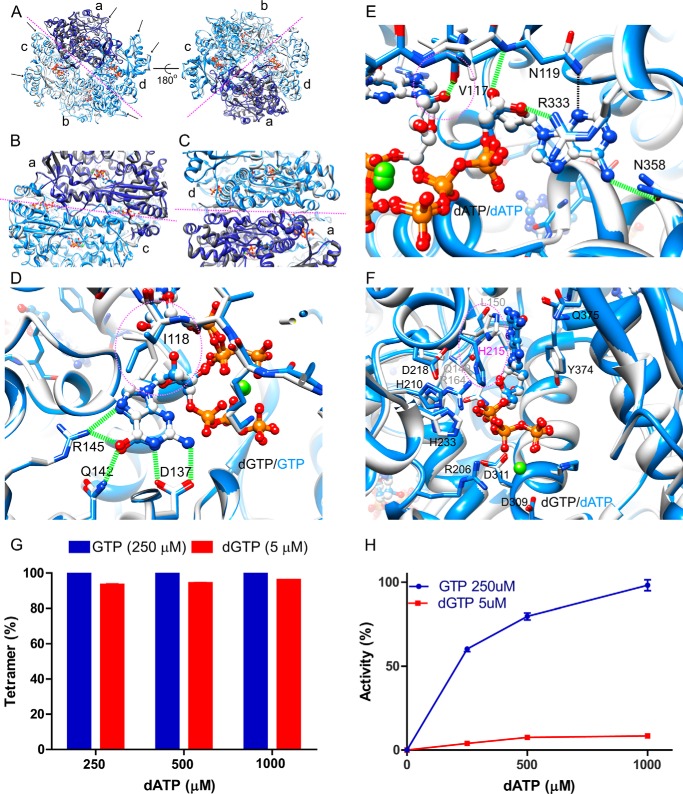
Structural comparison between SAMHD1c-dGTP/dATP and SAMHD1c-GTP/dATP. A–C, superposition of the SAMHD1c-dGTP/dATP (white with subunit a colored dark gray) and SAMHD1c-GTP/dATP structures (blue with subunit a colored dark blue). Overall comparison between the two tetramers is shown in A; the interface between the two dimers is displayed in B; and the interface between the two monomers in a dimer, formed by subunits a and d, is shown in C. The magenta dashed lines indicate the interfaces between the two dimers in the tetramer (A and B) or the two monomers in a dimer C. D and E, superposition of dGTP (carbon atoms in light gray) and GTP (carbon atoms in blue) in the primary allosteric site (D) and in the secondary allosteric site (E) in the structures of SAMHD1c-dGTP/dATP (carbon atoms in light gray) and SAMHD1c-GTP/dATP (carbon atoms in blue). The rotamer change of Ile-118 is illustrated by dashed magenta circles. F, superposition of the catalytic site region in the SAMHD1c-dGTP/dATP and SAMHD1c-GTP/dATP structures. Carbon atoms of dGTP and of dATP are colored white and blue, respectively. Note that the His-215 side chain is in a different orientation in the SAMHD1c-dGTP/dATP (light gray) and SAMHD1-GTP/dATP (blue) structures. G, tetramer formation of the SAMHD1fl H206R/D2077N mutant. The mutant protein was incubated with either a mixture of GTP (250 μm) or dGTP (5 μm) and increasing concentrations of dATP (250–1000 μm). H, dATPase activity of WT SAMHD1fl. Enzymatic activity was measured in the presence of either GTP (250 μm) or dGTP (5 μm) and for increasing concentrations of dATP (250–1000 μm). dATPase activity was normalized relative to that obtained with 250 μm GTP and 1 mm dATP.

