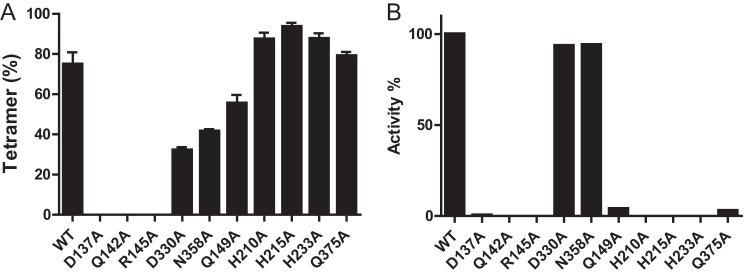
FIGURE 4.

Mutational analysis of allosteric sites and catalytic site residues. A, tetramer formation was determined by size exclusion column chromatography for WT SAMHD1fl and mutants in the presence of 250 μm GTP and 1 mm dATP as described in the legend to Fig. 2, B and C. B, dATPase activities were measured for SAMHD1fl mutants in the presence of 250 μm GTP and 1 mm dATP and normalized with respect to WT. Each experiment was performed in triplicate, and error bars reflect the S.D. in the measurement.
