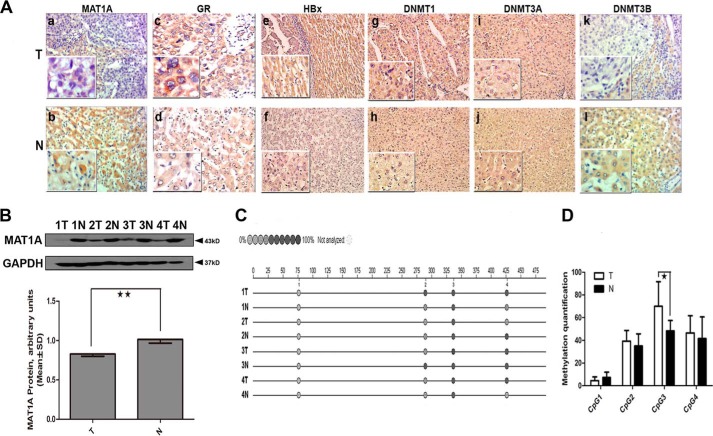
FIGURE 4.
Determination of MAT1A, GR, HBx, and DNMTs expression and methylation profiles in the MAT1A promoter in HBV-associated HCC tissues. A, representative results of immunohistochemistry analyses. Panels a and b, MAT1A; panels c and d, GR; panels e and f, HBx; panels g and h, DNMT1; panels i and j, DNMT3A; panels k and l, DNMAT3B. B, four adjacent paired HBV-associated HCC tissues (T) and peritumoral noncancerous tissues (N) were selected for immunoblotting analyses using antibodies to MAT1A and GAPDH proteins. The inset shows representative immunoblots of different tissues. **, p < 0.01. C and D, methylation profile of CpG sites for promoter sequence of MAT1A. *, p < 0.05. The color of the circles is related to the percent of methylation in each CpG site. Shown is a representative result from four independent experiments.

