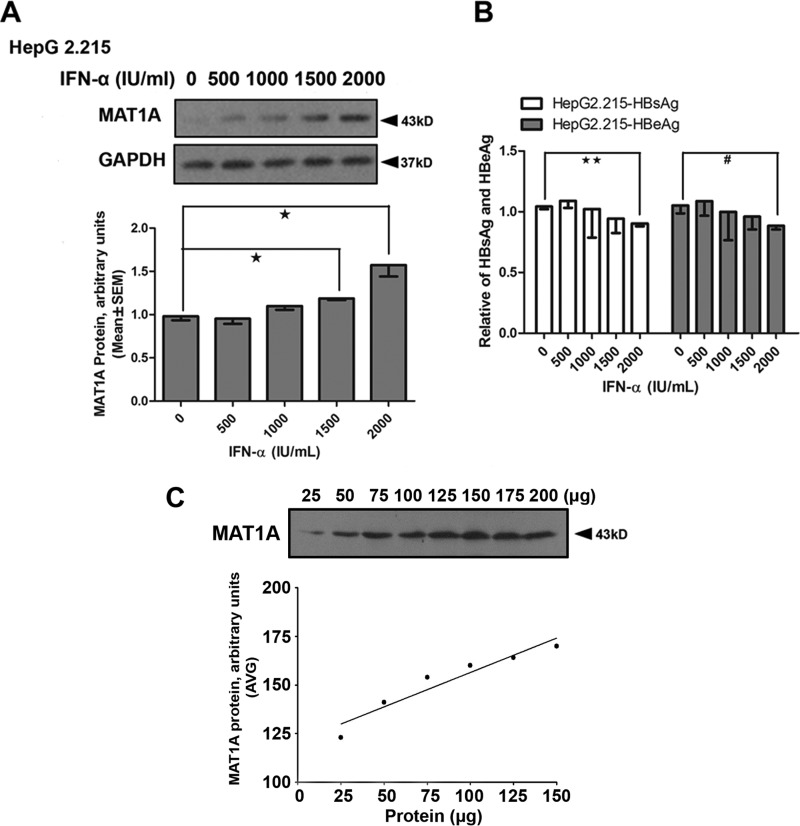
FIGURE 7.
Effect of IFN-α on expression of MAT1A, HBsAg, and HBeAg in HepG2.2.15 cells. A, MAT1A protein levels were detected in HepG2.2.15 cells after treatment with IFN-α. The inset shows representative immunoblots of MAT1A with different treatments. B, HBsAg and HBeAg were determined by ELISA after treatment with IFN-α in HepG2.2.15 cells. C, dilution curve of the total protein shows linear MAT1A protein levels from 25 to 150 μg of protein. *, p < 0.05, and **, p < 0.01; #, p < 0.05. Shown is a representative result from three independent experiments.

