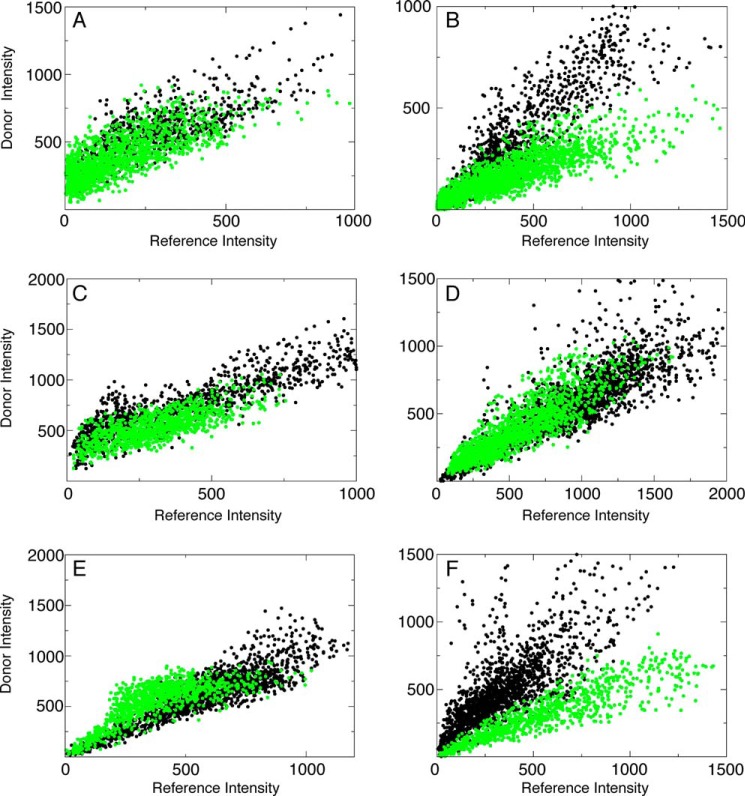
FIGURE 6.
Intermolecular FRET between helices after translocation. Scatter plot analysis of the intensities of the donor and acceptor on individual pixels in the absence (F′, black dots) and presence (FQ′, green dots) of another protein co-injected into cells that contains only the acceptor. A, no FRET is detected between helix α3 at position 78 on one Bax molecule and helix α2 at position 62 on another molecule before translocation as evidenced by the same correlation slope when protein with the acceptor is co-injected (F′, black dots, 1239 pixels, r = 0.86; FQ′, green dots, 2168 pixels, r = 0.75). B, after translocation, FRET is detected between the two sites in A evidenced by the lower correlation slope of the sample that contains the FRET acceptor (F′, black dots, 1049 pixels, r = 0.87; FQ′, green dots, 1720 pixels, r = 0.87). C, there is no contact between helix α5 on separate molecules before translocation evidenced by similar correlation slopes in the presence and absence of the acceptor, which also indicates no FRET (F′, black dots, 1053 pixels, r = 0.89; FQ′, green dots, 1405 pixels, r = 0.75). D, no contact between the sites in C are observed after translocation evidenced by the same correlation slope between the samples with and without the FRET acceptor (F′, black dots, 1405 pixels, r = 0.84; FQ′, green dots, 1668 pixels, r = 0.87). E, no intermolecular contact between helix α9 on separate Bax molecules is observed before translocation evidenced by the same correlation slope between samples with and without the FRET acceptor (F′, black dots, 1367 pixels, r = 0.90; FQ′, green dots, 887 pixels, r = 0.79). F, intermolecular contacts are observed between the sites in E evidenced by the lower correlation slope of the sample with the FRET acceptor (F′, black dots, 1487 pixels, r = 0.78; FQ′, green dots, 825 pixels r = 0.91).

