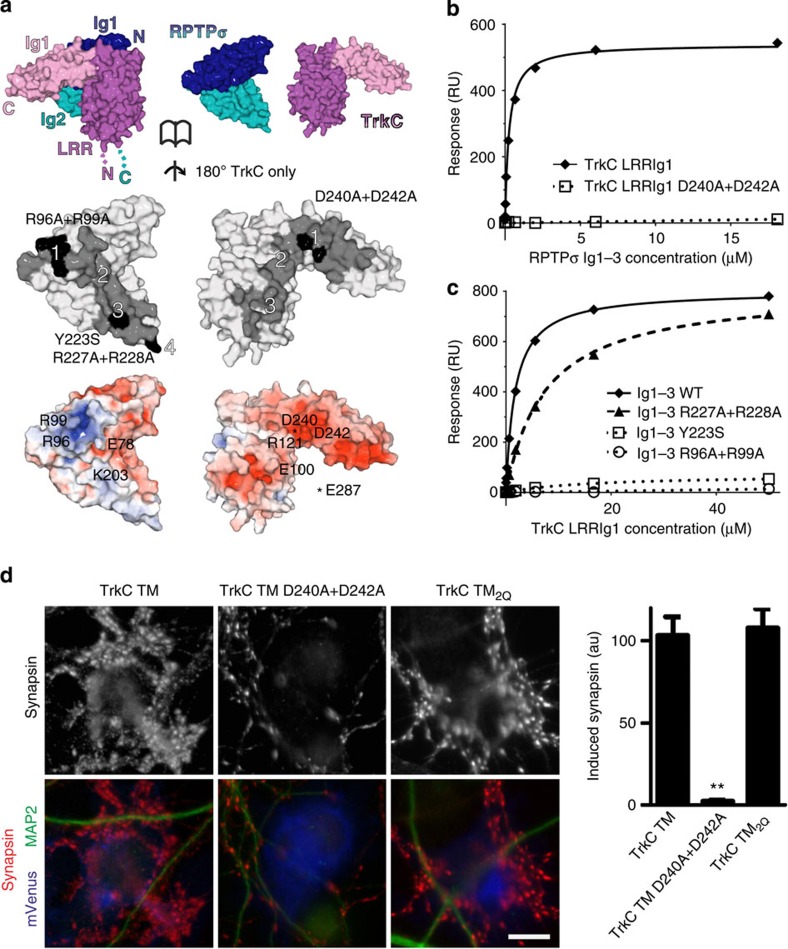
Figure 4. Validation of RPTPσ:TrkC binding interfaces.
(a) Opened-view surface representation of the chicken RPTPσ Ig1–2:TrkC LRRIg1cryst crystal structure. RPTPσ and TrkC interface residues are coloured grey and interface mutants used in biophysical and cellular assays are highlighted in black (middle panel). Binding sites 1–4 are labelled. RPTPσ and TrkC are coloured by electrostatic potential (bottom panel) from red (−8 kT/e) to blue (+8 kT/e), illustrating complementary charged patches at binding sites 1–3 (note that the basic RPTPσ ‘Lys-loop’ residues 68–71 are absent in the RPTPσ:TrkC complex crystallographic model). (b) SPR analysis of human RPTPσ Ig1–3 binding to immobilized mouse TrkC LRRIg1 and TrkC LRRIg1 D240A+D242A. Measured binding values: TrkC LRRIg1, Kd=258 nM and Bmax=540 RU; TrkC LRRIg1 D240A+D242A, Kd and Bmax not determined. (c) Mouse TrkC LRRIg1 binding to immobilized human RPTPσ Ig1–3 WT, R96A+R99A, Y223S and R227A+R228A. Measured binding values: RPTPσ Ig1–3 WT, Kd=1.8 μM and Bmax=802 RU; Ig1–3 R227A+R228A, Kd=7 μM and Bmax=806 RU; Ig1–3 R96A+R99A and Y223S, Kd and Bmax not determined. For sensograms see Supplementary Fig. 8c–f. (d) Induced synapsin clustering in rat hippocampal neurons by TrkC TM (WT), TrkC TM_D240A+D242A and TrkC TM2Q expressing COS-7 cells. Analysis of variance, P<0.0001; **P<0.001 compared with TrkC TM by post hoc Bonferroni’s multiple comparison test, n=26 cells from two experiments. Scale bar, 10 μM. Relative cell surface expression levels are shown in Supplementary Fig. 9.

