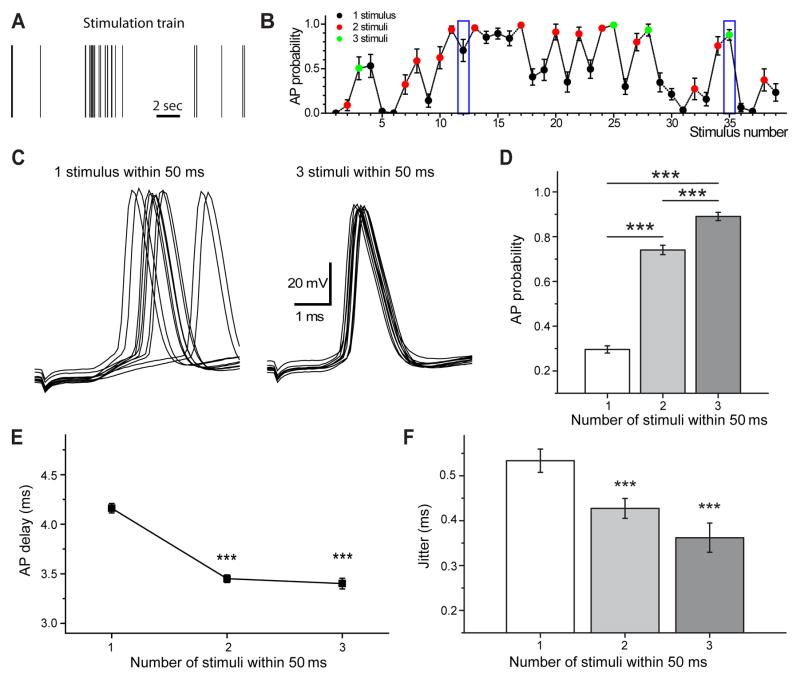
Figure 1.
Temporal precision of postsynaptic action potentials enhanced after natural short burst stimulation. A) Example of natural stimulation train and corresponding probability of evoked postsynaptic action potentials (B). Blue boxes indicate position of individual stimulus (1) and last stimulus in a 50 ms burst of three stimuli (3). Examples of postsynaptic spikes evoked by these stimuli are shown on C (ten traces included). Note the difference in the action potential jitter between single stimulation (1 stimulus within 50 ms, left) and stimulation after two preceding stimuli (3 stimuli within 50 ms, right). D) Action potential probability, delay (E) and jitter (F) as a function of the number of stimuli within 50 ms. Note that action potential probability significantly increases with the number of stimuli, while spike delay and jitter become significantly smaller after burst stimulation (2–4 stimuli, n=18). Error bars show standard error of the mean (SEM). ***p < 0.001, Student’s t-test.

