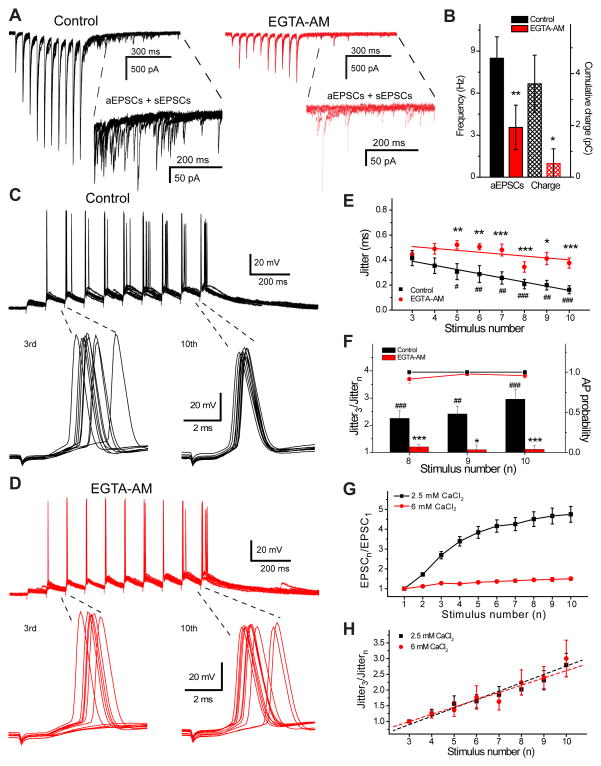
Figure 2.
Slow calcium chelator EGTA-AM blocks the asynchronous response and prevents spike dejittering. A) EPSCs evoked by stimulation trains (20 Hz, 10 stimuli) in control conditions (black) and after application of 100 μM EGTA-AM (red), five individual responses are shown. Inserts show expanded 500 ms regions with a mixture of aEPSCs and sEPSCs. B) Bar graph showing significant reduction in aEPSC frequency and cumulative transferred charge after EGTA-AM application. Examples of postsynaptic spikes evoked by 10 stimuli at 20 Hz in control (black, C) and after EGTA-AM (red, D). Action potentials evoked by the third and tenth stimuli are expanded, 10 responses are shown. Note that action potential jitter calculated within 6 ms after stimulation significantly decreases at the end of the train (C, bottom right) in control conditions, but not after EGTA-AM (D, bottom right). E) Significant decrease is observed in action potential jitter starting from the 5th stimulus (#p < 0.05, ##p < 0.01, ###p< 0.001; Student’s t-test), which is abolished in the presence of EGTA-AM (n=7). Significantly larger jitter is present after EGTA-AM application compared to control (*p < 0.05, **p < 0.01, ***p < 0.001; Student’s t-test). F) AP jitter decreases most profoundly at the end of the stimulation train in control condition (black bars), reaching a threefold decrease by the 10th stimuli. EGTA-AM (red bars) significantly impairs jitter reduction, even though it does not change AP probability (black and red squares) in response to last three stimuli. Normalized EPSC peak amplitudes (G) and AP jitter (H) recorded at 2.5 (black) and 6 mM (red) CaCl2 in response to 20 Hz stimulation train. Note that facilitation is more than three times smaller at high calcium concentration (n=25 and n=7 for 2.5 and 6 mM CaCl2, respectively), but AP jitter decreases to the same degree (n=8 and n=7 for 2.5 and 6 mM CaCl2, respectively). Dashed lines correspond to linear fits of the data. Error bars show standard error of the mean (SEM).

