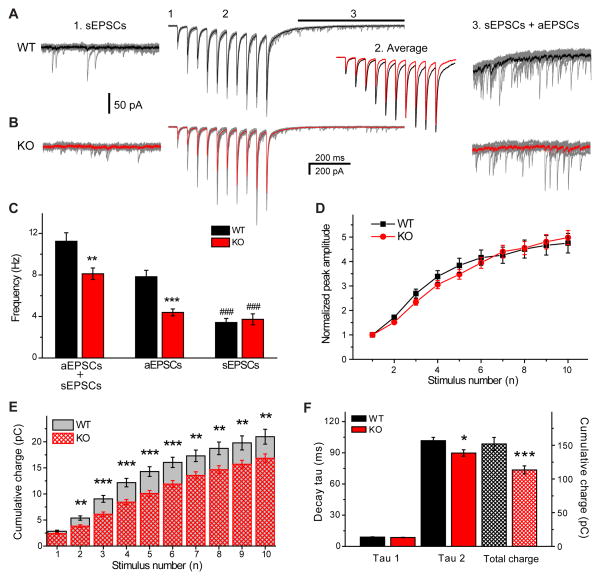
Figure 4.
Primary contribution of AP-3-derived vesicles to the asynchronous release. EPSCs recorded in response to 20 Hz stimulation trains (10 stimuli) in WT (A) and KO (B) mice. Ten individual responses are shown in grey, averaged evoked EPSCs in black (WT) and red (KO) are compared on the middle panel (2). Expanded regions show spontaneous (sEPSCs, left) and asynchronous (aEPSCs, right) events analysed within 500 ms before stimulation (1) and 200 ms after stimulation (black line, 3), respectively. C) Frequency of aEPSCs in comparison with total EPSC (aEPSCs + sEPSCs) and sEPSC frequencies. Note a significantly higher aEPSC frequency in WT mice compared to KO and similar sEPSCs frequency. In both cases sEPSC frequency was significantly lower than the total EPSC frequency after stimulation (*p < 0.05, **p < 0.01, ***p < 0.001, ###p < 0.001; Student’s t-test). D) Normalized potentiation of the synchronous component (eEPSCs) is similar between WTs and KOs, while the cumulative charge evoked by stimuli from 2 to 10 is significantly smaller in KOs (E). F) Bar graph shows that the fast decay component (tau1) of EPSCs evoked by the10th stimuli is not different in WTs and KOs. In contrast, the slow decay component (tau2) and the total cumulative charge are significantly higher in WTs, due to the larger number of asynchronous EPSCs (WT n=27, KO n=33). Error bars show standard error of the mean (SEM).

