Figure 8.
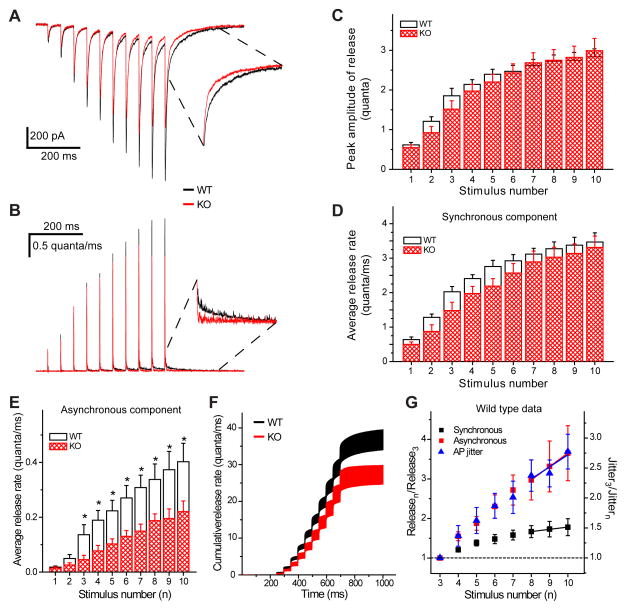
Deconvolution analysis of evoked EPSCs. A) Averaged EPSCs evoked by stimulation trains (20 Hz, 10 stimuli) and the corresponding release rate (B) are calculated using the deconvolution method. Inserts are showing expanded regions; note the difference in decay between WTs and KOs. C) Quantified release rate: The peak amplitude of release (C) and synchronous rate (integrated within the first 10 ms following each stimulus) (D) are similar in response to all 10 stimuli. Asynchronous rate of release (integrated between 10 and 50 ms after each stimulus) (E) is significantly higher in WTs, starting from the third response. Reduced asynchronous release significantly affects the total cumulative release (F). WT n=7, KO n=6. G) Deconvolution data shown together with AP jitter from separate sets of cells. Note that by the end of train the synchronous release (black) increase reaches a plateau; while increases in asynchronous release (red) and AP jitter (blue) continue to rise. Data are normalized to the 3rdresponse. Solid lines correspond to linear fits. *p < 0.05; Student’s t-test. Error bars show standard error of the mean (SEM).

