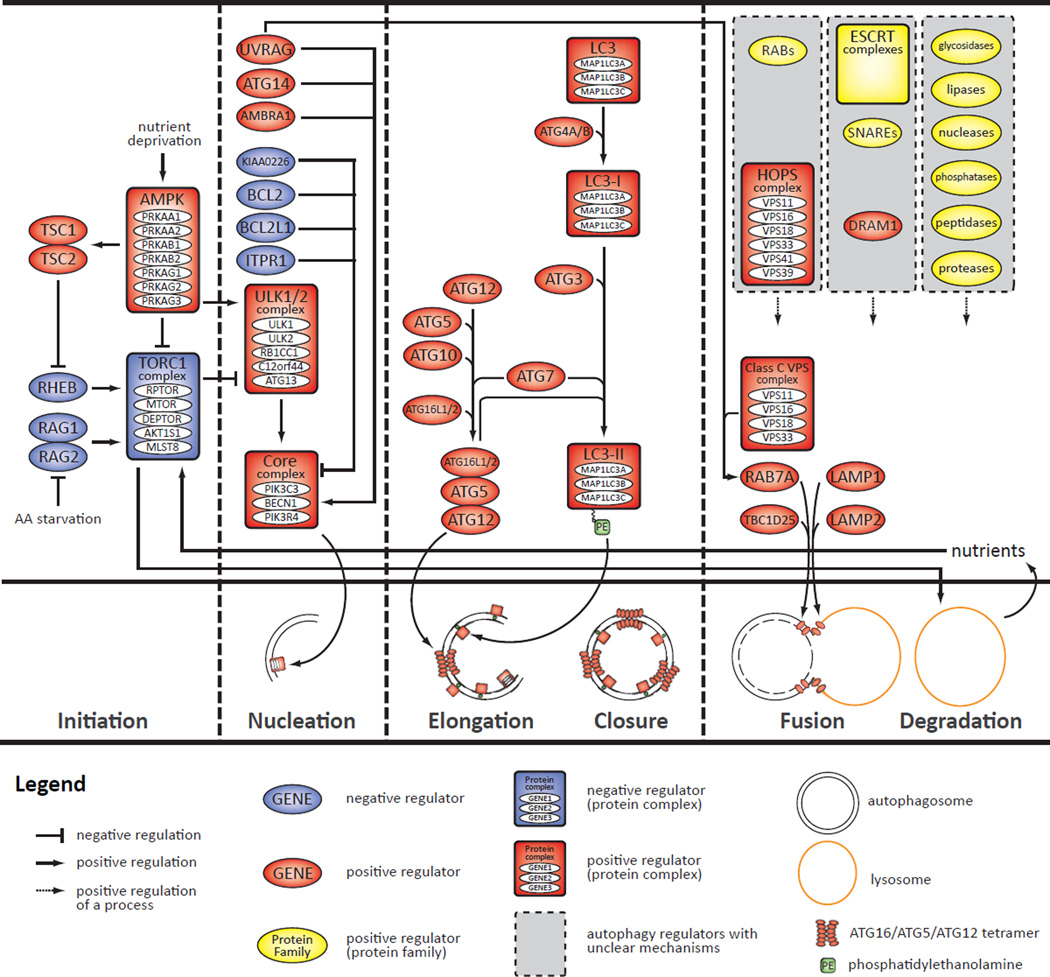
Figure 1. Molecular features of the autophagy process.
The top panel shows specific entities (genes, proteins, complexes, and small molecules) associated with that process and, to the extent possible, their specific roles. The middle panel shows a schematic timeline of the macroautophagy process (four steps separated by vertical dashed lines). The bottom panel defines entities that appear in the top two panels.

