Figure 1.
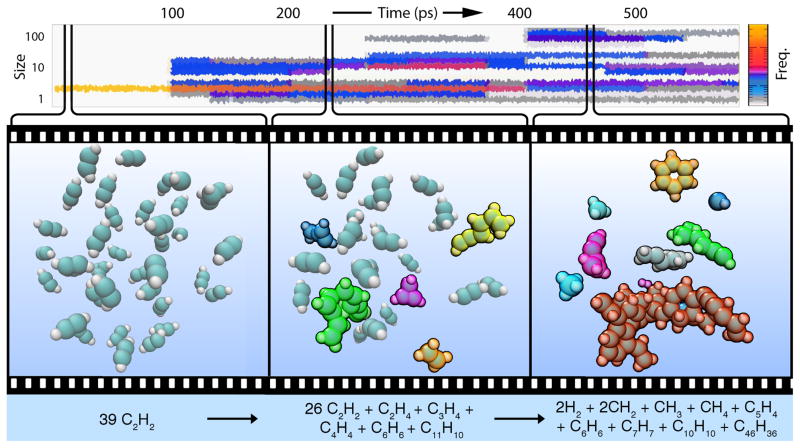
Timeline of a nanoreactor simulation trajectory (movie clip in Supplementary Video 1). Top: Molecular size distribution as a function of simulation time. Left: Simulation begins with a collection of acetylene molecules (C = teal, H = white). New molecules are automatically highlighted with molecule-specific colors to indicate observed reactivity. Middle: Simple products appear first, including short polymeric species (green, yellow) as well as ethylene (orange) and cyclopropene (violet). Right: At longer simulation times the molecular size distribution becomes considerably wider; more than half of the atoms form a large molecule containing multiple aromatic rings (red). A long-lived, inert benzene molecule is also formed (gold, top right).

