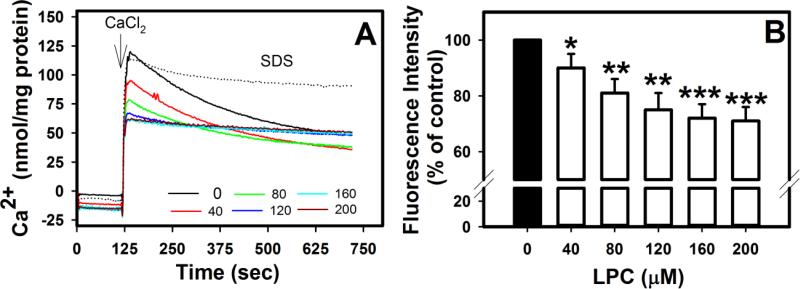
Fig. 4.
Effects of LPC on mitochondrial Ca2+ uptake. Mitochondria (0.7 mg/mL) were incubated with 1 μM Calcium Green 5N and the indicated concentrations of LPC or SDS. Extramembranous Ca2+ was calculated from fluorescence intensity measured at 538 nm after excitation at 485 nm prior to and after addition of 75 μM CaCl2. A shows representative tracings from 3 separate determinations and B shows the mean ± standard deviations of peak fluorescence intensity measured at 35 sec after CaCl2 addition. Differences from control samples without LPC addition are indicated as * P < 0.05, ** P < 0.01, *** P < 0.001.

