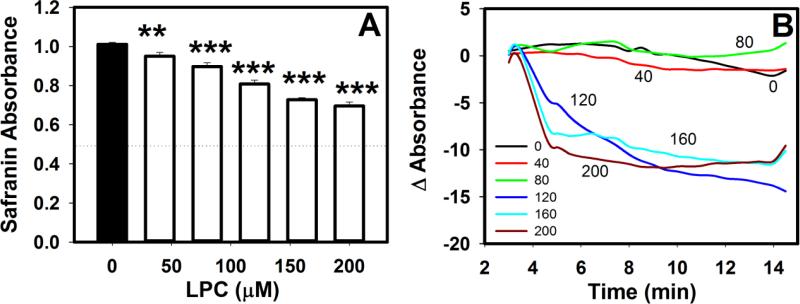
Fig. 5.
Effects of LPC on mitochondrial membrane potential. Mitochondria (0.7 mg protein/mL) were incubated with 25 μM safranin O and LPC at the indicated concentrations. A. Mitochondrial membrane potential was assessed after 2 min incubation based on absorbance at 530 nm. The absorbance of mitochondria incubated with SDS is indicated by the dotted line. The data represent mean ± standard deviations from 4 separate determinations. ** and *** denote differences from no LPC samples at P < 0.01 and P < 0.001. B. Kinetics of absorbance changes after incubating mitochondria with various concentrations of LPC as indicated. Standard deviations are similar to that in panel A but error bars are omitted from the graph for better visualization.

