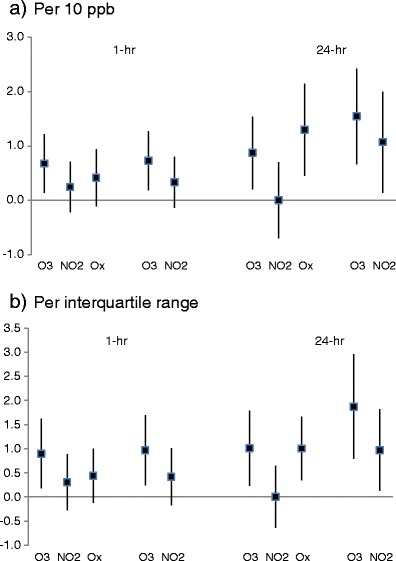
Fig. 2.

Percentage changes (95 % confidence intervals) in mortality associated with lag 1 day measures of maximum 1-h and mean 24-h concentrations of ozone (O3), nitrogen dioxide (NO2) and combined oxidant (Ox) in single-pollutant models and ozone and nitrogen dioxide in two-pollutant models. a Per 10 ppb. b Per interquartile range
