
Figure 2.
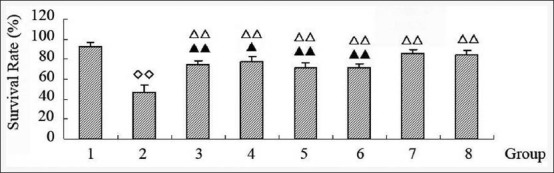
Comparison of neurocyte survival rate in hippocampus CA1 among the groups (1) Sham. (2) Model. (3) Astragaloside IV. (4) Ginsenoside Rg1. (5) Ginsenoside Rb1. (6) Notoginsenoside R1. (7) Four active components combination. (8) Edaravone. Values represent the mean ± standard deviation from the eight mice in each group; ∞P < 0.01, versus sham; ΔΔP < 0.01, versus model; ▴P < 0.05, ▴▴P < 0.01, versus four active components combination