
Figure 5.
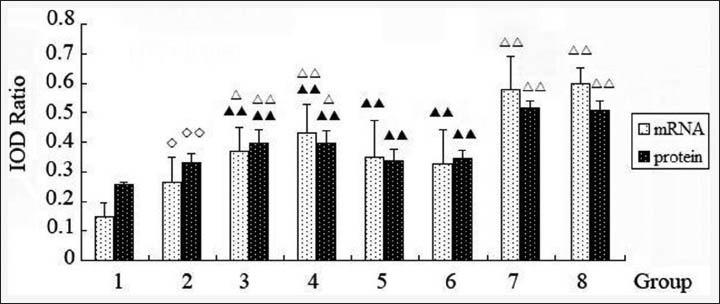
Comparison of heme oxygenase-1 messenger ribonucleic acid and protein expression in brain tissues among the groups: (1) Sham. (2) Model. (3) Astragaloside IV. (4) Ginsenoside Rg1. (5) Ginsenoside Rb1. (6) Notoginsenoside R1. (7) Four active components combination. (8) Edaravone. Values represent the mean ± standard deviation from the eight mice in each group; ◊P < 0.05, ◊◊P < 0.01, versus sham; ΔP < 0.05, ΔΔP < 0.01, versus model; ▴▴P < 0.01, versus four active components combination