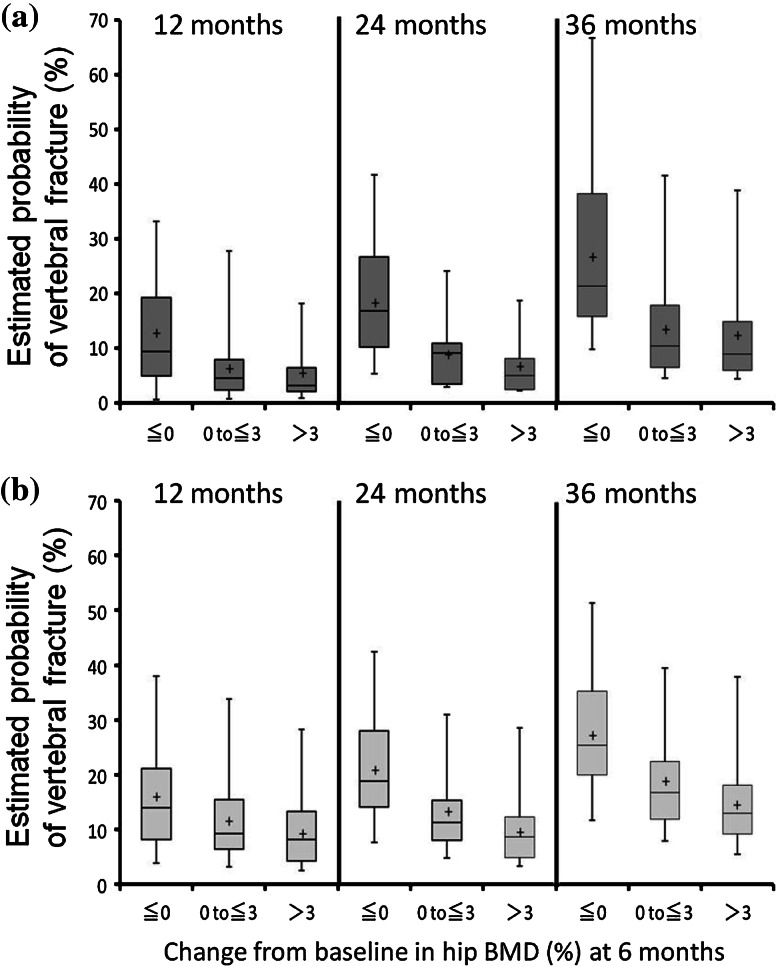
Fig. 2.
Estimated probability of incidence of vertebral fractures according to gains in hip BMD in patients treated with ibandronate (a) and risedronate (b) at 12 months (left column), 24 months (middle), and 36 months (right). The upper and lower fences represent the maximum and minimum values, respectively. The box represents the interquartile range. The cross indicates the mean value and the horizontal line indicates the median value

