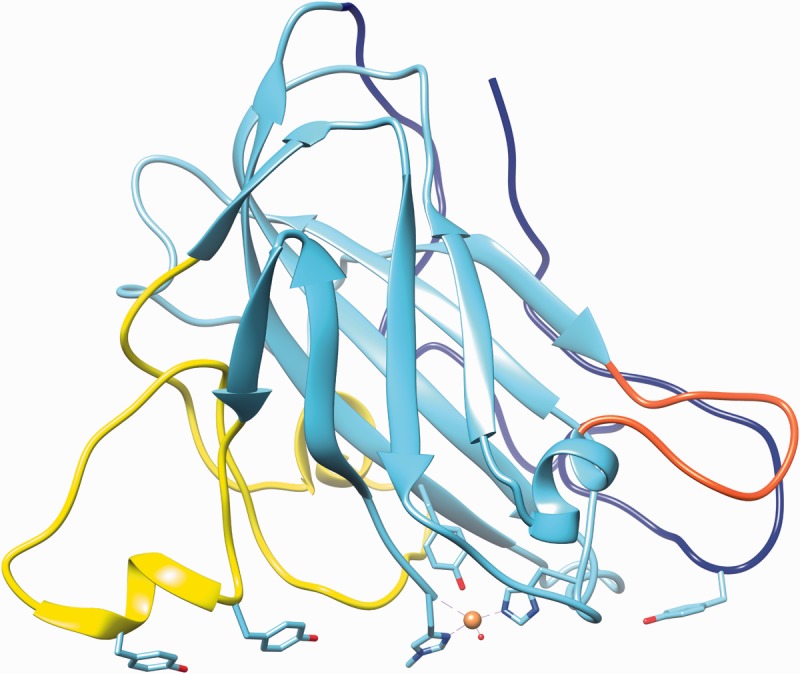
Figure 1:

Representative AA9 LPMO from N. crassa selected for lowest average RMSD value among Protein Data Bank models. The structure shown is Q7SA19 [47], and the highlighted loops and residues also incorporate information from [10]. Highlighted in yellow, blue and red are the loops L2, the C-terminal and the short loop, respectively. The copper atom is shown as a sphere with the coordinating residues (two histidines) and the axial tyrosine in stick representation. The three tyrosines of loops L2 and the C-terminal loop, presumed to interact with cellulose substrate, are also indicated in stick representation. The image was created using PDB entry 4EIS with the UCSF Chimera package developed by the Resource for Biocomputing, Visualization and Informatics at the University of California, San Francisco [48]. (A colour version of this figure is available online at: http://bfg.oxfordjournals.org)
