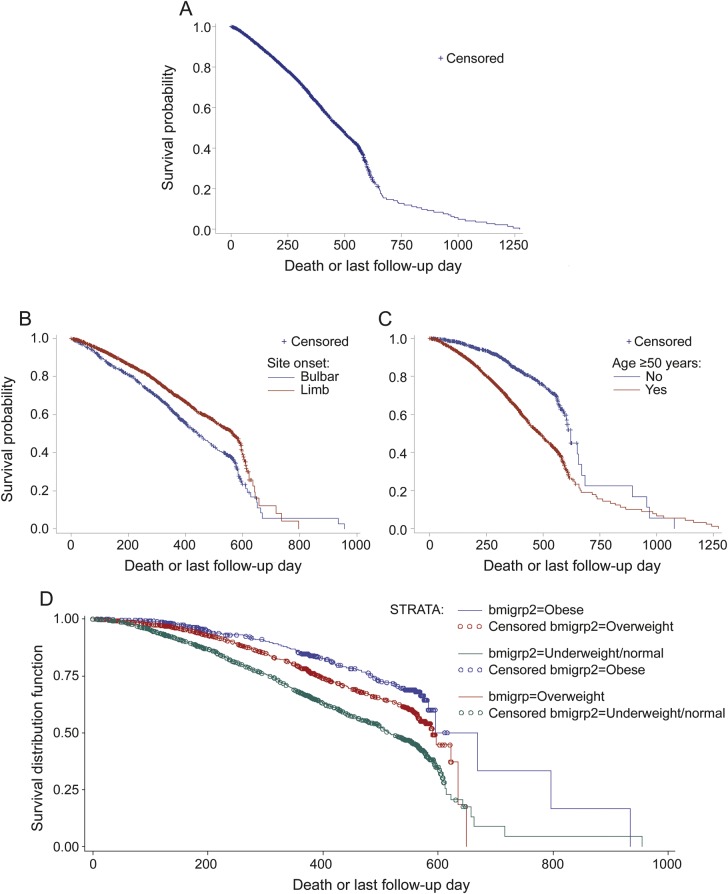
Figure 2. Kaplan-Meier curves, product-limit survival estimates.
(A) Kaplan-Meier curve for all amyotrophic lateral sclerosis (ALS) trials. The median survival time in the Pooled Resource Open-Access ALS Clinical Trials database is 479 days from trial entry. (B) Kaplan-Meier curves for site of onset. People with limb-onset ALS (red) had better survival (p < 0.0001) compared to people with bulbar-onset ALS (blue). This survival advantage for people with limb-onset ALS remained significant (p = 0.04) even after controlling for age, sex, and time from symptom onset to diagnosis. (C) Kaplan-Meier curves for age at onset. People with younger age (<50 years) at ALS onset (blue) show longer survival (p < 0.0001) compared to people with older age (≥50 years) at ALS onset (red). This survival advantage for younger age remained significant (p < 0.0001) even after controlling for site of onset, sex, and time from symptom onset to diagnosis. (D) Kaplan-Meier curves for body mass index (BMI). People who were obese (hazard ratio [HR] 0.46, p < 0.0001) or overweight (HR 0.65, p < 0.0001) at trial entry had less risk of dying compared to people who were underweight or had normal BMI.

