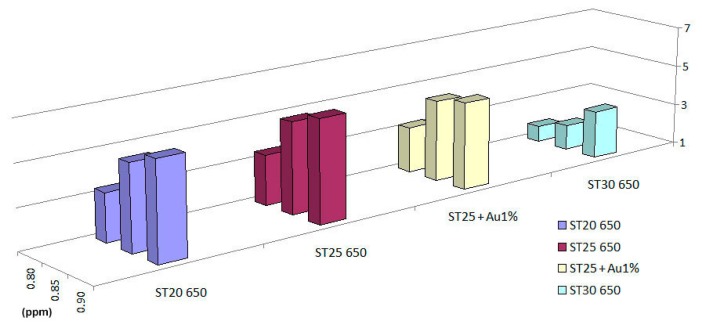
Figure 9.
Bar-chart of the responses of sensors to 1-iodo-nonane in wet conditions (RH: 17%–19%) for the following flows: (2.024 ± 0.002) × 106 mol/min (I), (2.153 ± 0.002) × 106 mol/min and (2.271 ± 0.001) × 106 mol/min (III); these correspond to concentrations of: 0.80 (I), 0.85 (II) and 0.90 (III) ppm.

