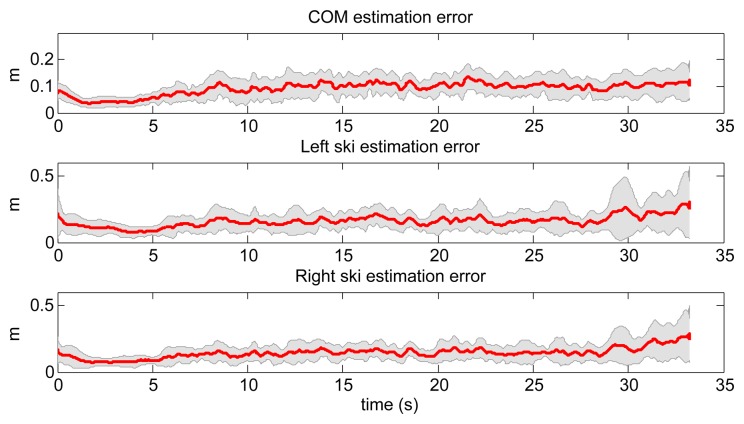
Figure 11.
Mean error between the estimated and true value of COM positions and both skis positions by using NN for all 18 ski runs. Yellow, green blue and red lines denote the antenna trajectory, COM trajectory and left and right skis trajectories, respectively. Measured trajectories are solid lines, and estimated ones are denoted with dotted lines.

