Figure 8.

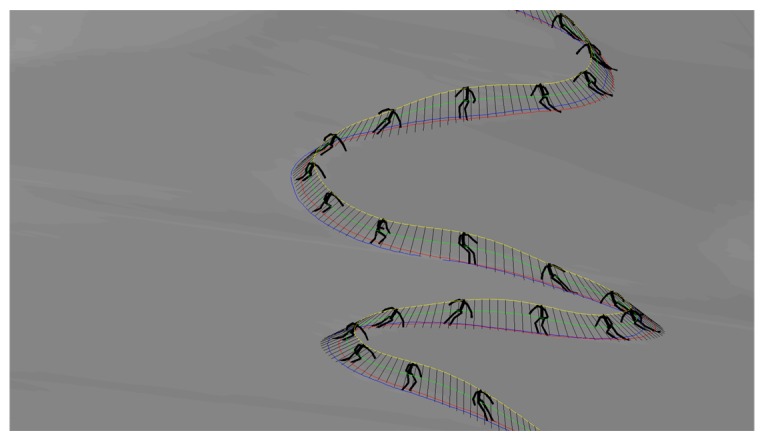
A comparison of inverted pendulum model (black line) and measured pose based on a 22 segment model. Yellow, green, red and blue color denote the antenna, COM, right ski and left ski trajectories, respectively.

A comparison of inverted pendulum model (black line) and measured pose based on a 22 segment model. Yellow, green, red and blue color denote the antenna, COM, right ski and left ski trajectories, respectively.