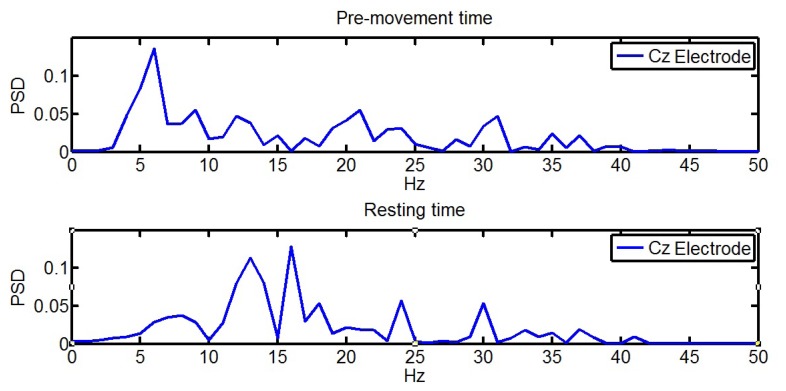
Figure 4.
FFT performed on a single pre-movement (top) and resting (bottom) data of the electrode Cz. In this case, features in pre-movement are 0.1760, 0.2993, 0.0749 and in the sample of resting data are 0.1784, 0.5455 and 0.0722. In pre-movement data, there is lower activity in the 13–24 Hz band sum than in the resting data.

