
Figure 3.
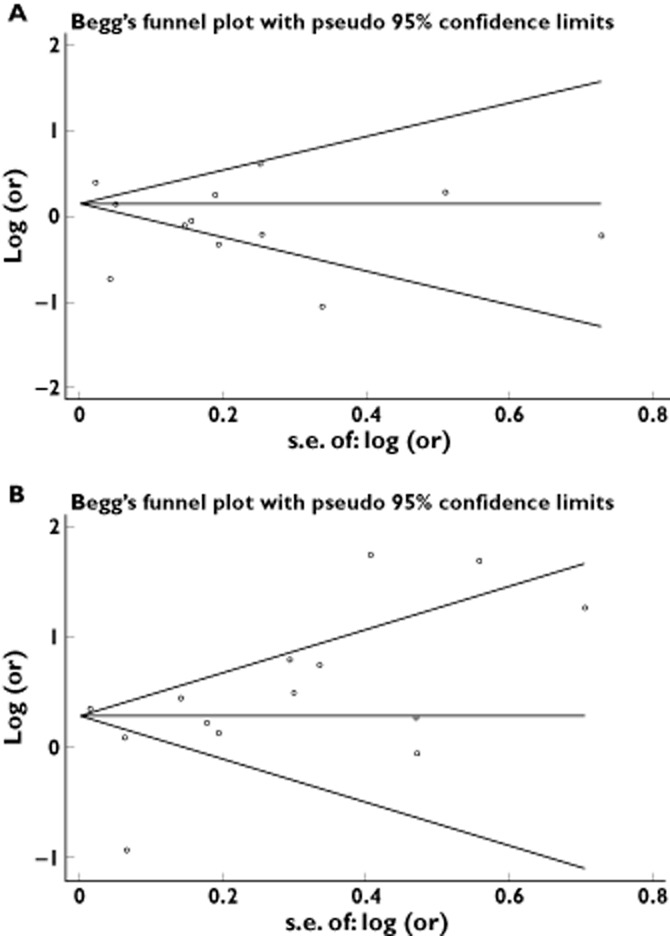
(A) Begg's funnel plot and Egger's test risk for identifying publication bias in the studies on SSRI use (Egger's test, P for bias = 0.401). (B) Begg's funnel plot and Egger's test risk for identifying publication bias in the studies on TCA use (Egger's test, P for bias = 0.725)