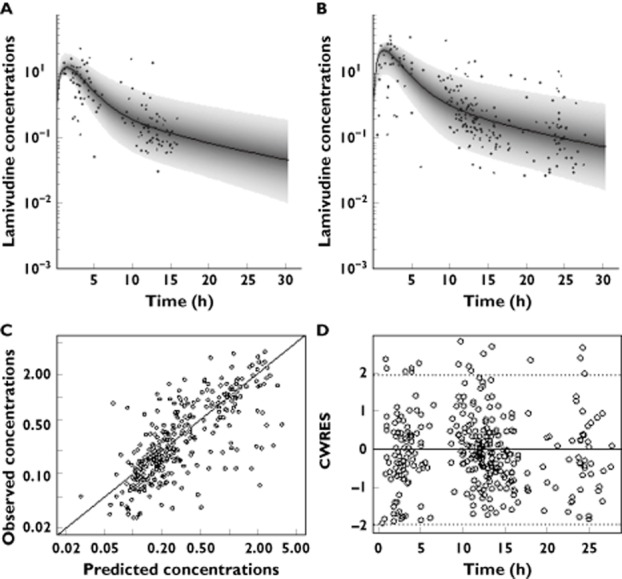
Figure 1.

Prediction distribution from the model (median associated with 95% prediction interval) for twice daily (A) and once daily dosing regimen (B). Diagnostic plots of the final model: observed vs. predicted concentrations (C) and conditional weighted residuals (CWRES) vs. time (D)
