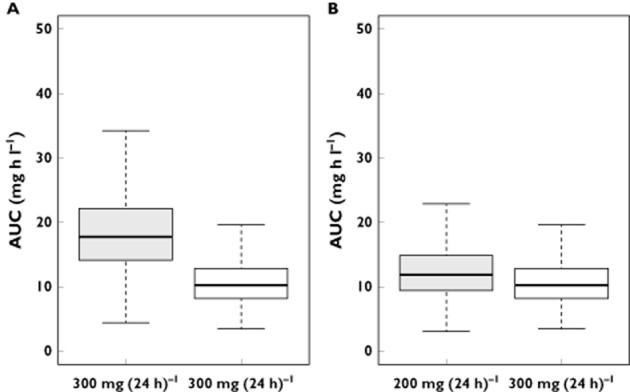
Figure 5.

(A) Box plots of AUC0–24h derived from Monte Carlo simulations of 300 mg day−1 in patients with creatinine clearance from 50 to 80 ml min−1 (mild renal impairment) and in patients with normal renal function. (B) Box plots of AUC0–24h derived from simulations of 200 mg day−1 in patients with mild renal impairment and of 300 mg day−1 in patients with normal renal function.  , creatinine clearance 50–80 ml min−1; □, normal creatinine clearance
