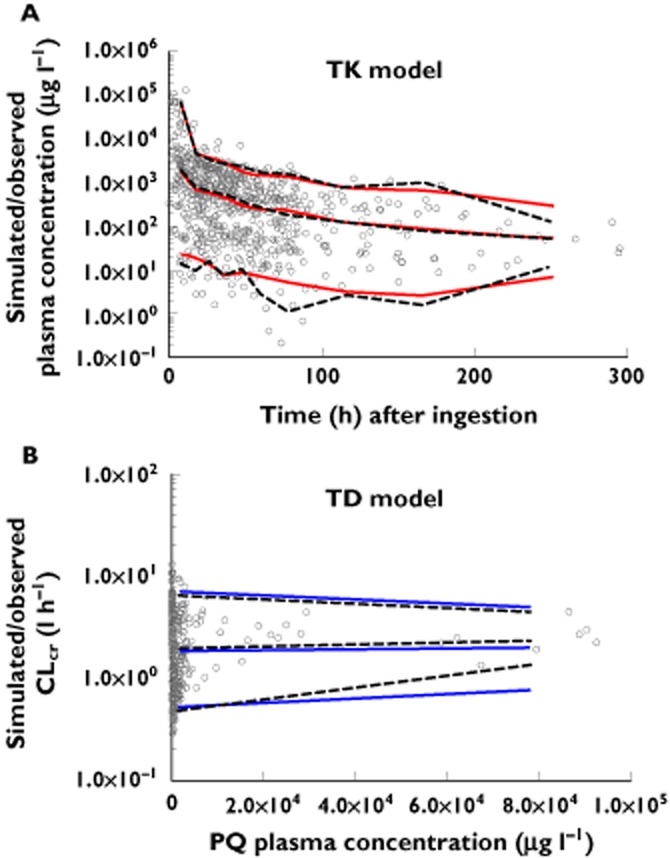
Figure 4.

Scatter plots for visual predictive check: observed and simulated concentrations vs. time (A) and observed and simulated CLcr vs. paraquat plasma concentrations (B). Percentiles (5, 50 and 95) were calculated using the final pop TK and TD model. (A)  , observed quantiles, 5, 50, 95%;
  , predicted quantiles, 5, 50, 95%; (B)
  , observed quantiles, 5, 50, 95%;
  , predicted quantiles, 5, 50, 95%
