
Figure 7.
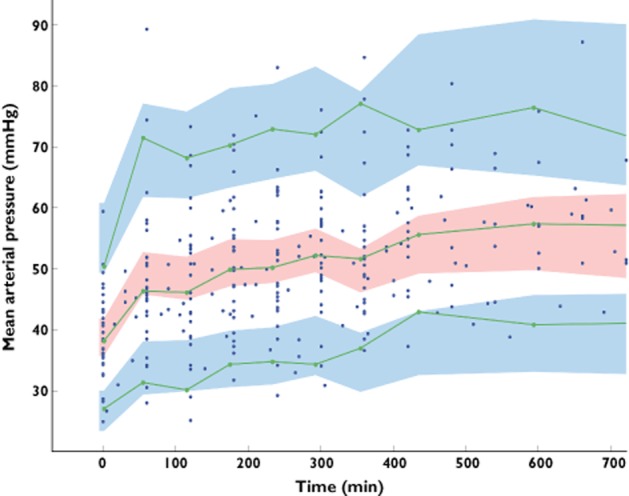
Prediction corrected-visual predictive check (PC-VPC) for mean arterial pressure observations vs. time. The green lines depict the 5th, 50th and 95th percentiles of observed data; the areas represent the 95% confidence interval around the simulated percentiles. The blue colour represents the 5th and 95th percentile of the predicted mean arterial pressure vs. time while the pink colour represents the median predicted mean arterial pressure vs. time. Time 0 min represents the starting time of norepinephrine infusion.