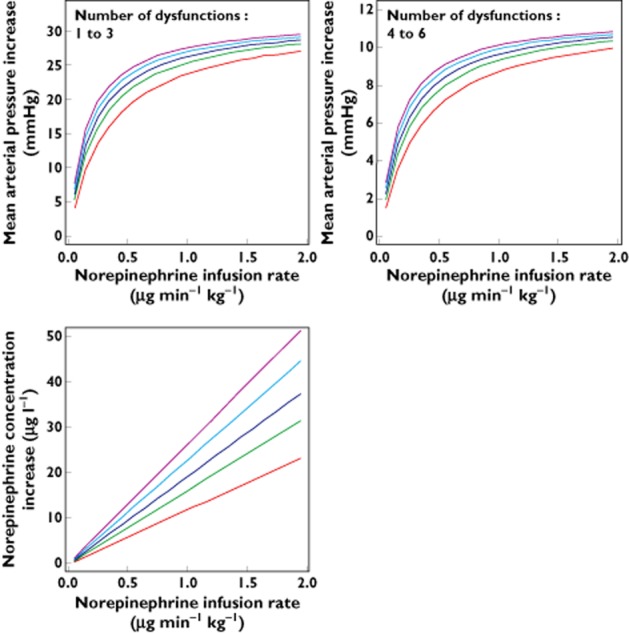
Figure 8.

Dosing simulations depicting the increases in norepinephrine concentration and haemodynamic responses as a function of infusion rate in children of different bodyweights and ages for patients with a number of organ dysfunctions ≤3 or ≥4, respectively. Body weight (kg):  3, age (months): 0.462; body weight (kg):
  10, age (months): 12; body weight (kg):
  20, age (months): 72; body weight (kg):
  40, age (months): 144; body weight (kg):
  70, age (months): 300
