
Figure 4.
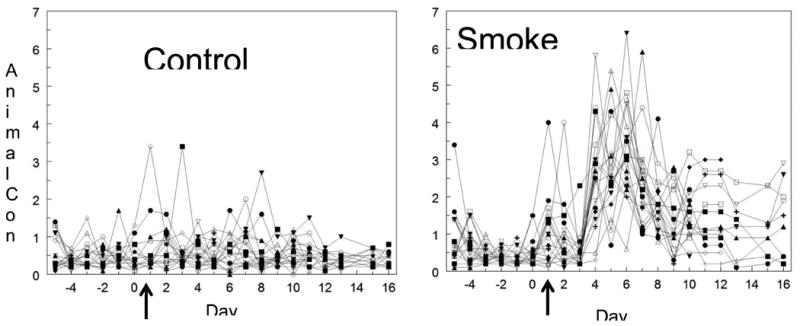
Daily alcohol intake during the 2 hour alcohol access period for each individual mouse. A. A plot of the daily alcohol consumption (g/kg) in each mouse for the control group. The control mice showed fairly stable drinking throughout the study. The arrow represents the first day when smoke was introduced to the smoke-exposed group. B. A plot of the daily alcohol consumption for the mice in the smoke group. The data show the alcohol drinking variability of the mice during the smoke phase. The arrow represents the first day of smoke exposure. Days 1-3 were the adolescent “binge” period of smoking, which did not cause a significant increase in alcohol intake during those initial days. However, on Days 4 through 7 there was an increase in drinking 4-5 times over the controls, followed by a large drop in intake on Days 8-9, that then stabilized to a level about 3-fold above the controls. From Day 13 to Day 16, 2 cigarettes per ten minutes were used without a significant change in alcohol consumption.