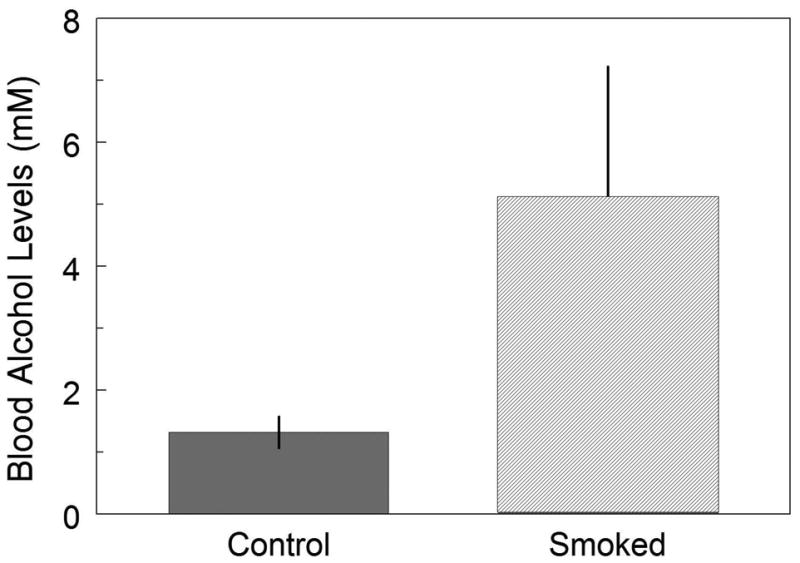
Figure 5.

Average BAC after 2 hours of alcohol intake for the control and smoke-exposed groups pooled from Day 12 and Day 16. The bars illustrate the averaged (∼4‐fold) increase in BAC in the smoke-exposed group compared to the control group. *p < 0.05.
