
Figure 1. Representative 1H-NMR spectra of HClO4 extracts of iRBCs (top), cRBCs (middle) and uRBCs (bottom).
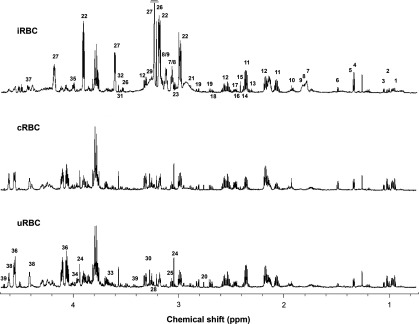
1. Leucine, 2. Isoleucine, 3. Valine, 4. Lactate, 5. Threonine, 6. Alanine, 7. Putrescine, 8. Spermidine, 9. Spermine, 10. Acetate, 11. Glutamate, 12. Oxidized glutathione, 13. 4-Aminobutyrate, 14. Pyruvate, 15. Succinate, 16. α-Ketoglutarate, 17. Glutamine, 18. Malate, 19. Aspartate, 20. Sarcosine, 21. Asparagine, 22. HEPES, 23. Lysine, 24. Creatine, 25. Ornithine, 26. Choline, 27. Phosphocholine, 28. Carnitine, 29. Arginine, 30. Betaine, 31. myo-Inositol, 32. Glycine, 33. Sorbitol, 34. Serine, 35. Phosphoethanolamine, 36. 2,3-Bisphosphoglycerate, 37. NAD+, 38. ATP, 39. Glucose. Other metabolites listed in Table 1 are not in the region shown. The horizontal bar in the top panel signifies that the peak was truncated.