
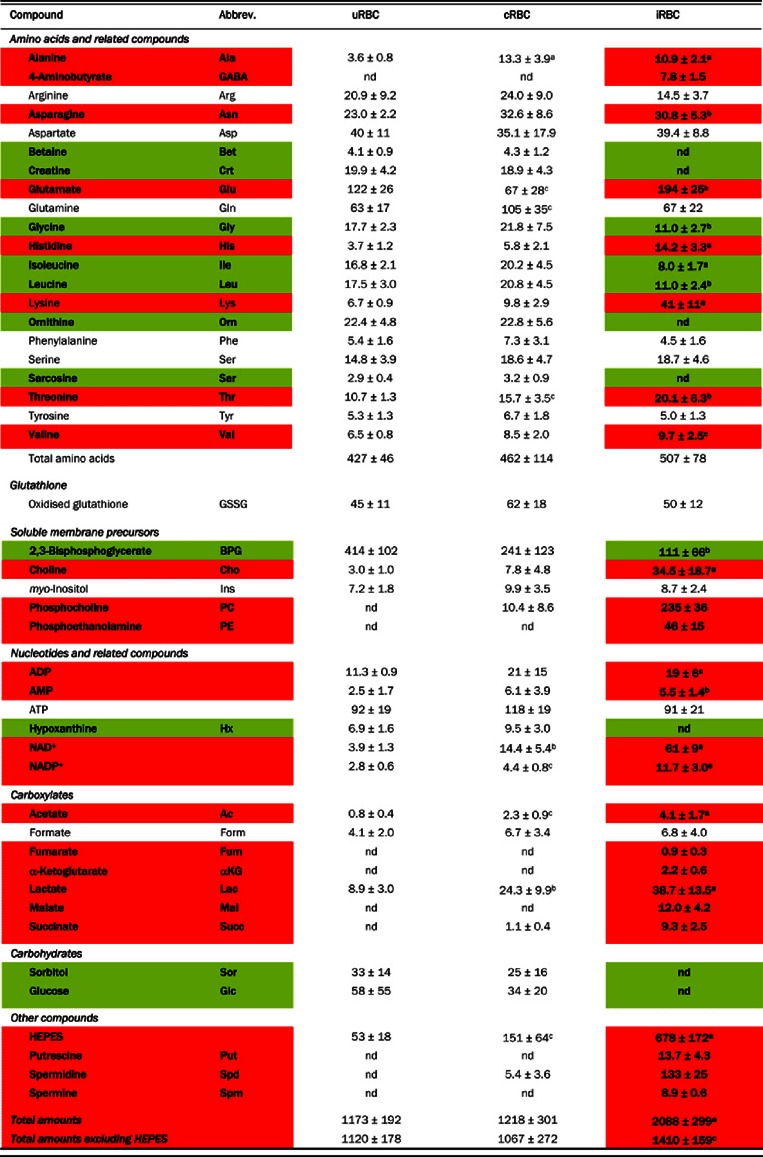
Table 1. Metabolite amounts in uRBCs, cRBCs and RBCs infected with 3D7 trophozoites (iRBCs).
The metabolite amounts (μmol per 1012 cells; obtained by 1H-NMR) are the means (shown ±S.D.) from 6 independent cell preparations (obtained on different days). The cRBC preparations contained up to 5% contamination with iRBCs and the iRBC preparations had up to 5% contamination with cRBCs. Depending on the metabolite, the amounts presented here are all within 95%-109% of the values that would have been obtained had the cell preparations been 100% pure. nd, not detected in some or all replicates. aP<0.001, bP<0.01 and cP<0.05, compared to uRBC, from one-way ANOVA tests using the natural logarithm transformed data (nd data excluded). The P values were corrected for multiple hypothesis testing using the False Discovery Rate (FDR) method of Benjamini and Hochberg [51]. Red shading: more abundant in iRBCs than in uRBCs; green shading: less abundant in iRBCs than in uRBCs.
 |