
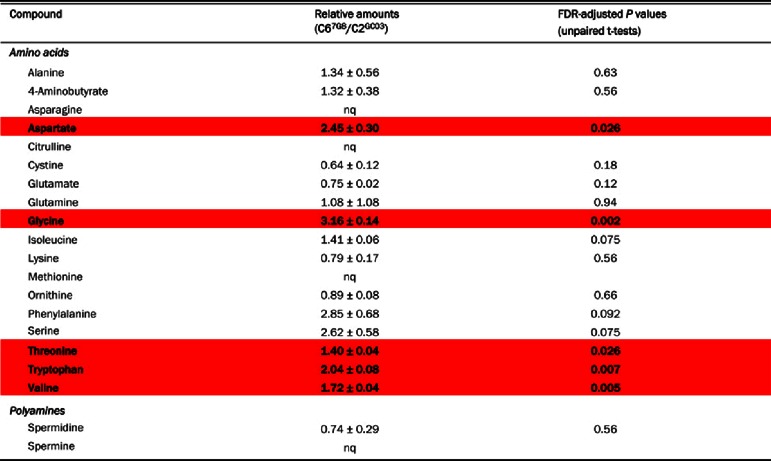
Table 4. Relative intracellular metabolite amounts obtained by HPLC in RBCs infected with C2GC03 or C67G8 trophozoites.
The data are averaged from three independent cell preparations (obtained on different days) for each line and are shown ±S.E.M. A value >1 indicates that a metabolite is more abundant in C67G8 iRBCs; a value <1 indicates that a metabolite is more abundant in C2GC03 iRBCs. nq, not quantified because these compounds were not detected in all experiments (asparagine and spermine were only detected in experiments with C67G8 iRBCs). Red shading: significantly more abundant in C67G8 iRBCs than in C2GC03 iRBCs.
 |