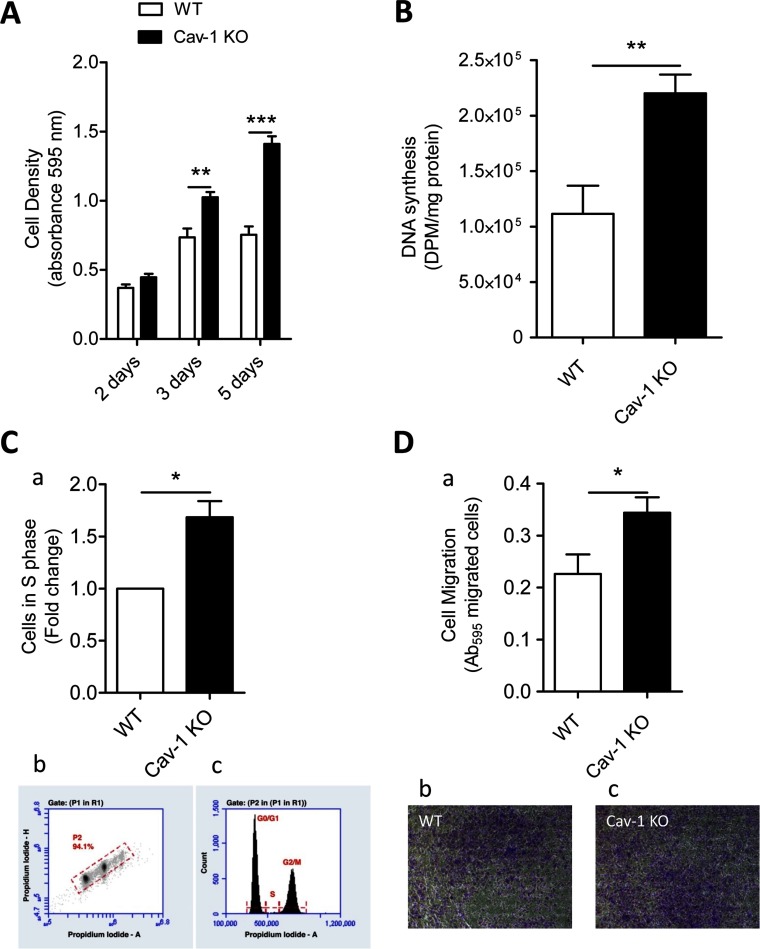
Figure 2. Cav-1 KO ASMCs show higher proliferation and migration rates than WT cells.
(A) Identical numbers of Cav-1 KO and WT cells were seeded at time 0 and cell density was assessed 2, 3 and 5 days after cell seeding. (B) DNA synthesis was assessed by measuring incorporation of 3H-thymidine into newly synthesized DNA 3 days after cell seeding. (C) The Cav-1 KO and WT cells were stained with propidium iodide (PI) by standard staining protocols 5 days after cell seeding. Flow cytometry of ASMCs derived from Cav-1 KO and WT mice show accumulation of Cav-1 KO cells in the S phase of the cell cycle (a). Dot plot of PI -Area/PI -Height with the gate set on the single cell population for DNA content analysis (Gate P2) for one representative sample of wild-type cells (b). This gate excludes debris and aggregates. Representative histogram of cells in G0/G1, S, and G2/M phases from WT cells (c). (D) Cell migration was evaluated by transwell chamber migration assay. Cav-1 KO cells migrate more than WT cells (a). Representative images of crystal violet staining of Cav-1 KO (c) and WT (b) cells. Three or four replicate cultures were performed. Values are presented as means±S.E.M. n=4–7 for each group. ** and *** represent P<0.01 and P<0.001, respectively.

