
Figure 6.
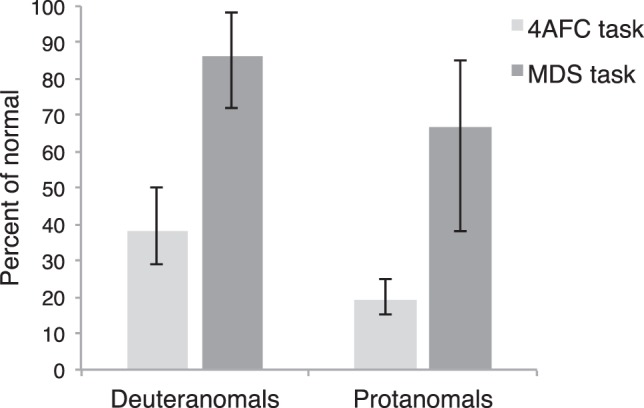
Percentage of normal mean sensitivity ratio for deuteranomals and protanomals in the 4AFC task (light gray bars) and percentage of normal mean color difference ratio for deuteranomals and protanomals in the MDS task (dark gray bars). Error bars are bootstrapped 95% CIs.