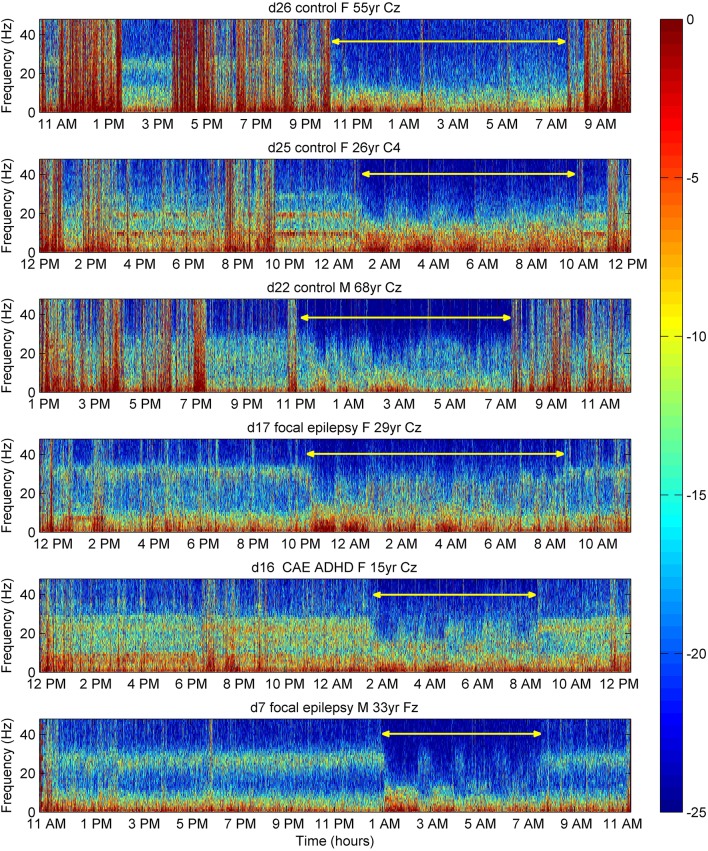
Figure 6.
Time frequency plots of EEG power (color-coded dB) in six individual subjects over 24 h. Electromyogram contamination appears as vertical red lines. During sleep (yellow line), especially during slow-wave-sleep correlating with an increase in 0–10 Hz power (dense red in spectrogram), there was suppression of power of the 26–32 Hz peaks. Variation in peak power during the day is evident in control subject d25. F, female; M, male; yr, years of age; CAE, childhood absence epilepsy; ADHD, attention deficit hyperactivity disorder. For medication in subjects with neuro-psychiatric disorder, see Table 5 in Supplementary Material.

