Figure 2.
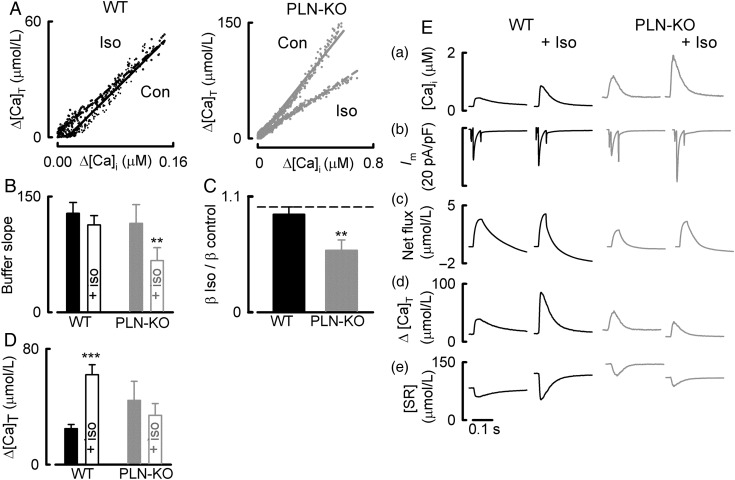
The effects of ISO on Ca buffering in WT and PLN-KO myocytes. (A) Buffer curves derived from caffeine-evoked currents. In both panels, data from control and ISO (100 nM) are shown with linear regressions. Left-hand panel shows WT and right-hand PLN-KO. (B) Mean data showing the effects of ISO on the buffer slope in WT (left) and PLN-KO (right). (C) The effects of ISO on buffer power. The bars show the ratio of buffer power in ISO/buffer power in control for WT (left) and PLN-KO (right). (D) The calculated increase of cytoplasmic total Ca during systole. Solid bars, control; open, ISO. (E) Quantitative analysis of Ca fluxes. The two left-hand columns are WT and the right-hand PLN-KO myocytes. From top to bottom: [Ca2+]i; current; net change of cell Ca (calculated from Ca influx and efflux); change of total cytoplasmic Ca; change of SR Ca. **P < 0.01; ***P < 0.001. PLN-KO: n = 9–11 cells/6 animals; WT: n = 5–12 cells/4–6 animals.

