Figure 3.
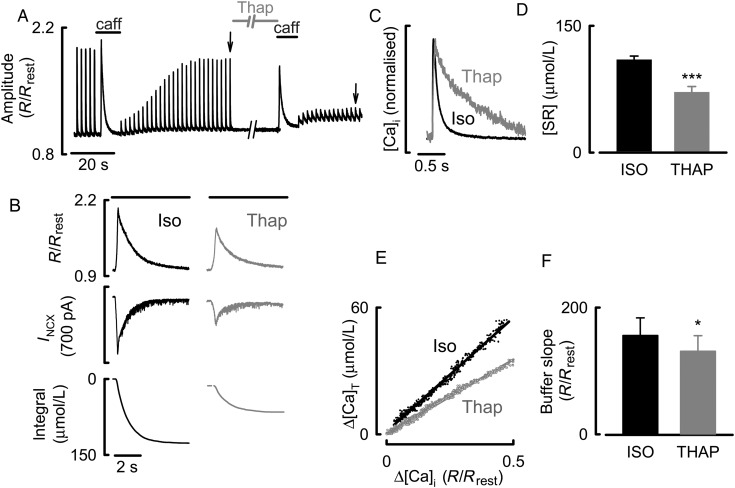
The effects of thapsigargin on Ca handling and buffering. (A) Timecourse. The cell was stimulated with voltage-clamp pulses in the presence of ISO (100 nM). Caffeine/BDM (caff) or thapsigargin (Thap, 5 µM) was applied as indicated. Stimulation was stopped during these periods. (B) Measurement of SR Ca content and Ca buffering. The three traces show R/Rrest, membrane current, and calculated change of total SR Ca. The left-hand panel was obtained in ISO and the right following 90 s exposure to thapsigargin (5 µM), horizontal bars represent the application of caffeine/BDM. (C) Specimen, normalized Ca transients obtained at the times shown by arrows in A. (D) SR Ca content in control (left) and thapsigargin (right). (E) The bottom graph shows the buffer curves obtained in ISO and thapsigargin with linear regressions. (F) Slope of buffer curve in ISO (left) and thapsigargin (right). *P < 0.05; ***P < 0.001, n = 10 cells/3 animals.

