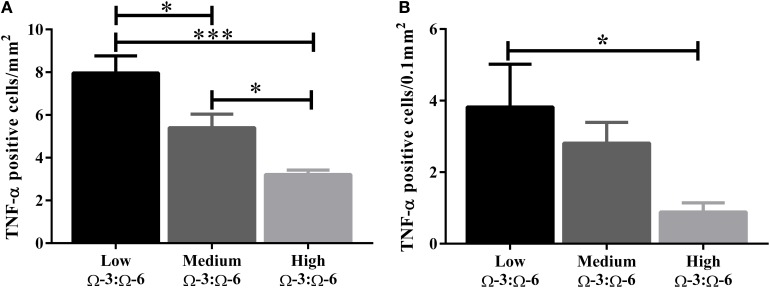
Figure 3.
Total number of TNF-α positive cells in the hippocampus. The total number of TNF-α positive cells in (A) the hippocampus (including the dentate gyrus) and (B) the dentate gyrus only. Data analyzed by One-Way ANOVA within strains with Tukey's post-hoc test, *p < 0.05, ***p < 0.001, as indicated on figure. All data presented as mean ± SEM (n = 5/group).

