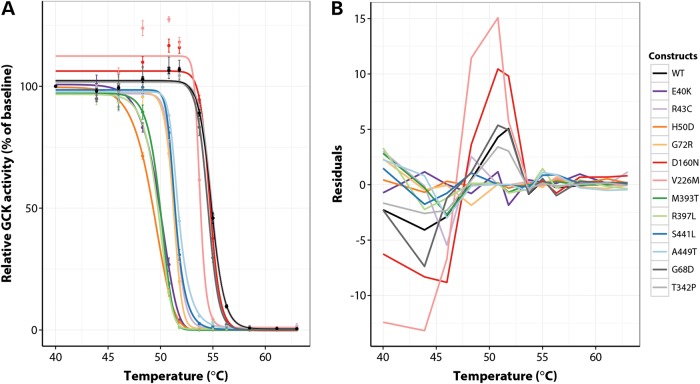
Figure 3.
Assessment of thermostability for WT and mutant human GST-GCK proteins. Logistic regression modelling was used to fit an activity curve to each protein in (A). Data were normalized to the baseline level of activity for each protein at 40°C. Each point represents mean activity ± SEM (n = 3 experiments except for WT and p.T342P n = 10 and p.D160N n = 6). The raw residuals, defined as the difference between observed and predicted values, for all proteins are shown in (B).

