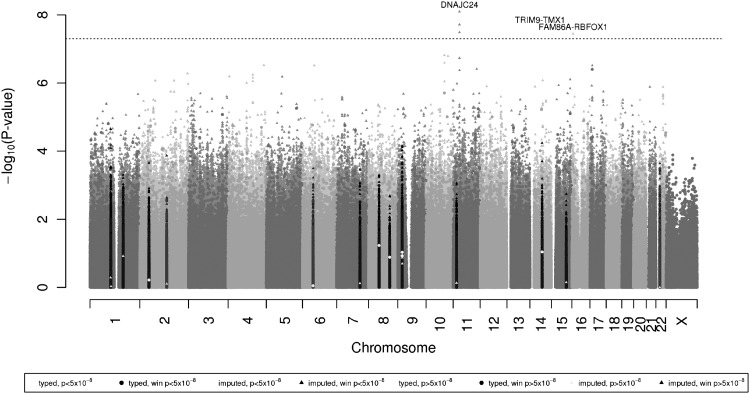
Figure 1.
Manhattan plot of glaucoma association for African Americans. P-values combine incident and prevalent coefficients using an inverse variance method. The dotted line here marks genome-wide significance at 5 × 10⁻⁸. Inflation factor λ = 1.022. In the plot/legend, the color code of the P-values corresponds to the P-value in previously reported studies; in the legend, for example, “genotyped, P < 5 × 10⁻⁸” indicates that a previous study had a P-value of <5 × 10⁻⁸, i.e. genome-wide significant, and “genotyped, win P < 5 × 10⁻⁸” indicates that it is within 0.5 Mb of such an SNP (a 1 Mb window). Triangles are imputed SNPs and circles are genotyped SNPs.

