Figure 3.
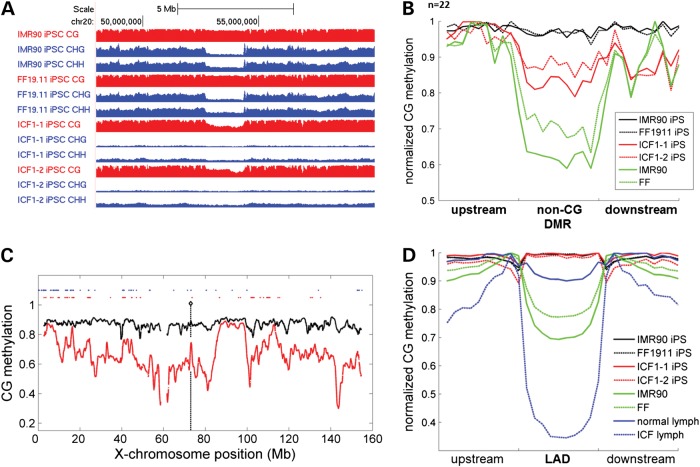
ICF iPSCs have aberrant megabase domains of hypomethylation. (A). Genome browser view of methylation level in a representative normal iPSCs and ICF1-1 iPSCs. Note coincidence of reduced non-CG methylation in normal iPSCs and reduced CG methylation in ICF1 iPSCs. CG methylation tracks are colored in red (y-axis limits between 0 and 1) and non-CG methylation tracks are colored in blue (y-axis limits between 0 and 0.05 for CHG methylation and 0–0.02 for CHH methylation). (B). Metaplot analysis of CG methylation in non-CG DMRs for control and ICF1 iPSCs as well as somatic cells. (C). Methylation profile of X-chromosome in ICF1 (red) and control (black) iPSCs. Loci of upregulated genes are shown in red dots and known loci of X-chromosome inactivation escape genes are shown in blue dots. (D). Average methylation profile across LADs in control and ICF iPSCs and somatic cells.

