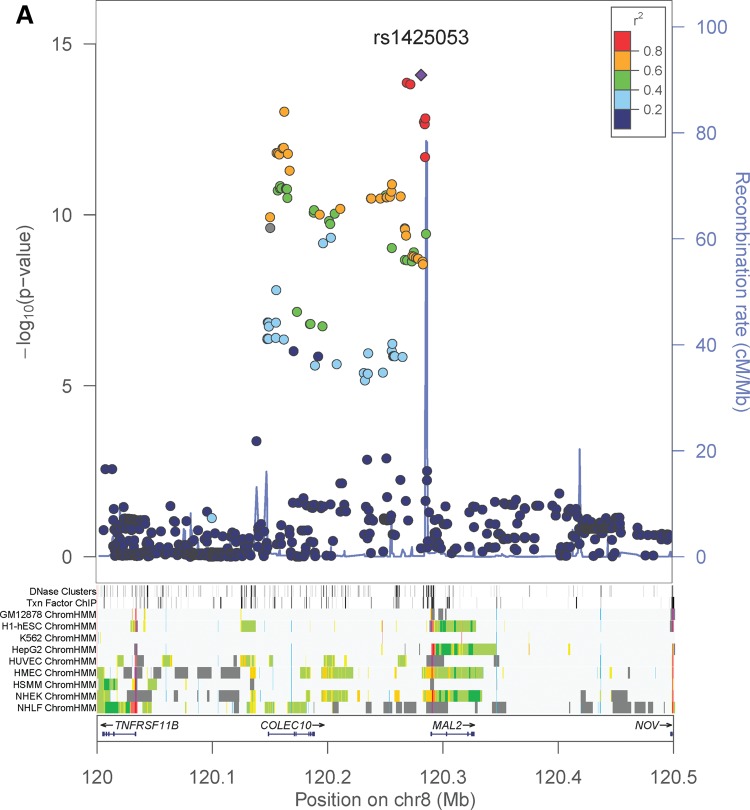
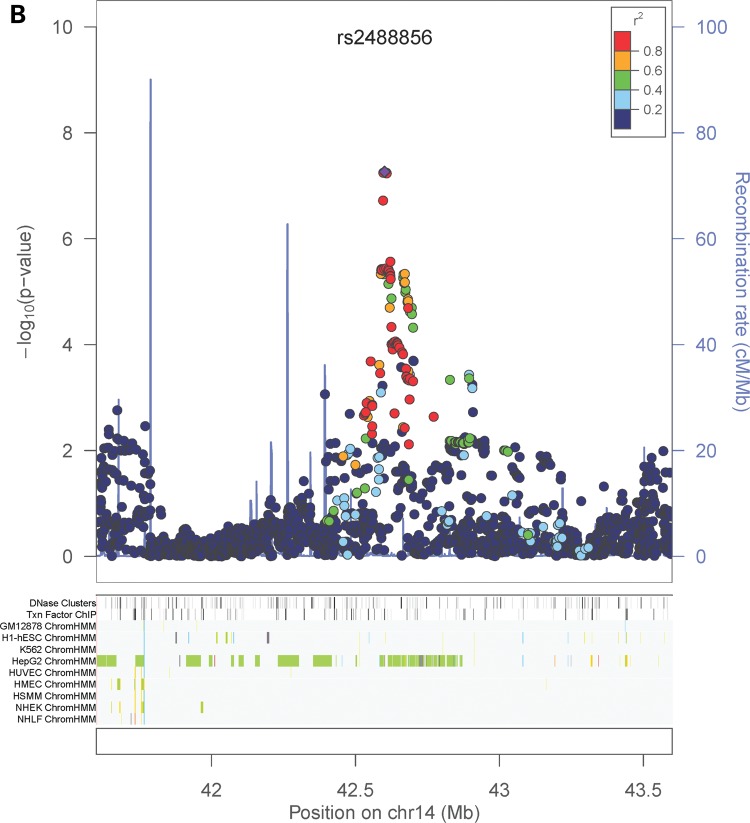
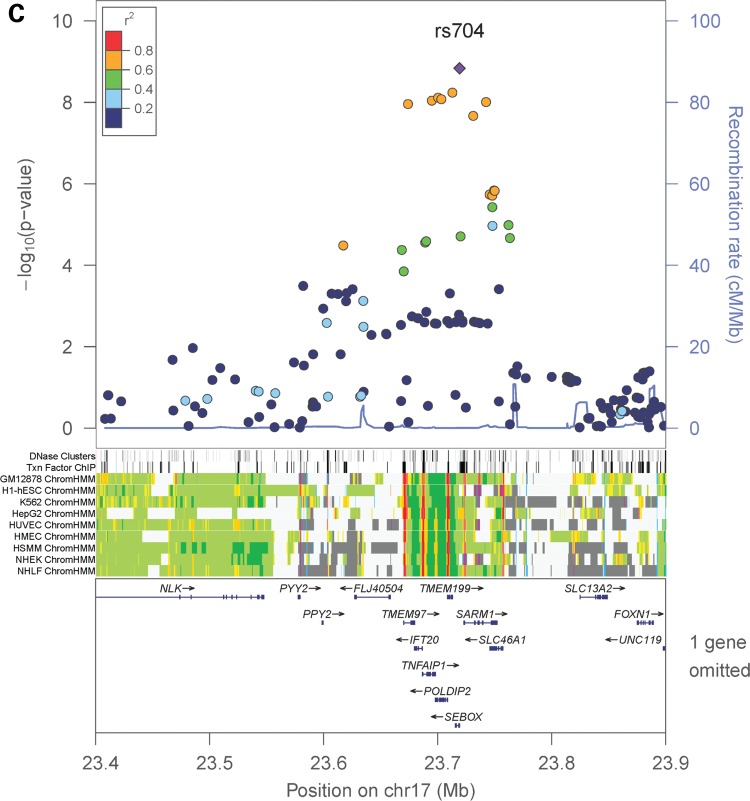
Figure 3.
Regional association plots and ENCODE annotation of the loci that reached or marginally reached genome-wide significance (P < 5 × 10⁻⁸) in the sex-combined meta-analysis. The X-axis indicates the physical position of each SNP on the chromosome specified, whereas the Y-axis denotes the evidence of association shown as −log(P-value). ENCODE annotation are also provided, including transcription factor-binding sites (TFBS) from 95 cell lines, DNase I hypersensitivity sites (DNase HS) from 125 cell lines, and chromatin states in nine ENCODE cell lines (GM12878, H1-hSEC, K562, HepG2, HUVEC, HMEC, HSMM, NHEK and NHLF). The chromatin states are annotated as follows: strong enhancer (orange), weak enhancer (yellow), active promoter (red), poised promoter (pink), insulator (blue), transcribed (pale green), transcription transition (dark green), repressed (dark gray) and heterochromatin (pale gray).


