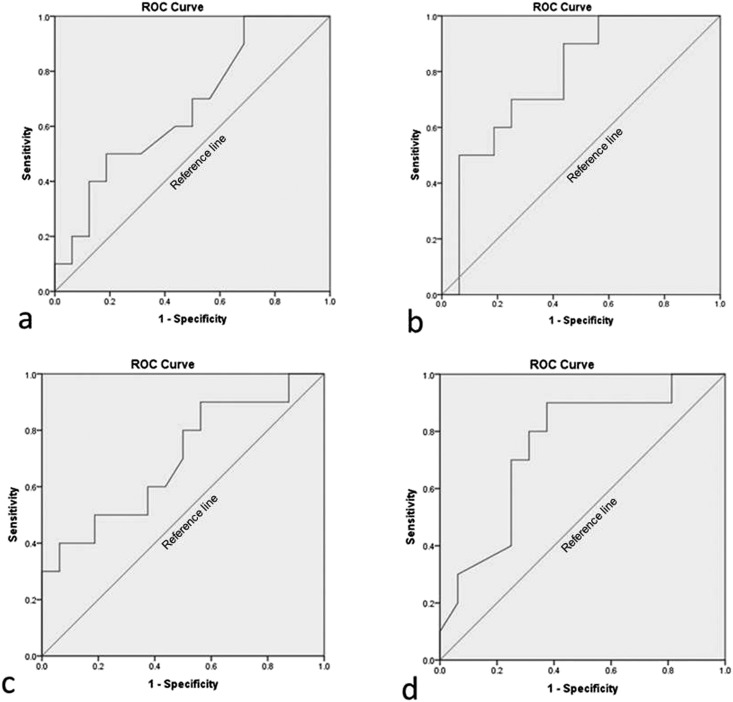
Figure 3.
Receiver operating characteristic (ROC) curve figures of asymptomatic and symptomatic groups for myogenous temporomandibular disorders. (a) Normalized mean temperature of right temporal muscle (area under the ROC curve = 0.669); (b) normalized mean temperature of left temporal muscle (area under the ROC curve = 0.781); (c) normalized mean temperature of right masseter muscle (area under the ROC curve = 0.697); and (d) normalized mean temperature of left masseter muscle (area under the ROC curve = 0.750).

