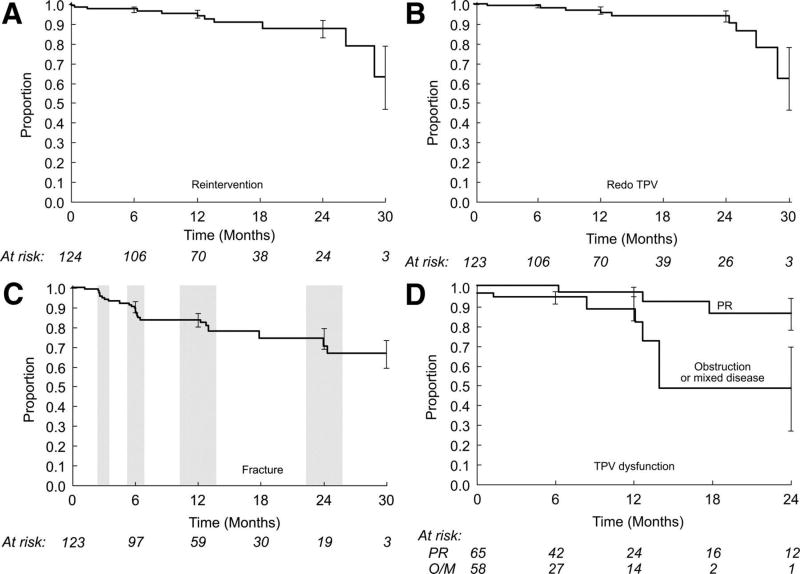
Figure 5.
Kaplan–Meier curves depicting (A) survival free from RVOT reintervention, (B) freedom from placement of a second Melody valve, (C) freedom from diagnosis of stent fracture, and (D) freedom from Melody valve dysfunction, with separate curves for patients with a primary implantation indication of PR and those with an indication of RVOT obstruction or mixed disease (O/M). Error bars indicate SE. The shaded regions in the graph showing freedom from diagnosis of stent fracture indicate the follow-up windows for the 3-, 6-, 12-, and 24-month evaluations.

