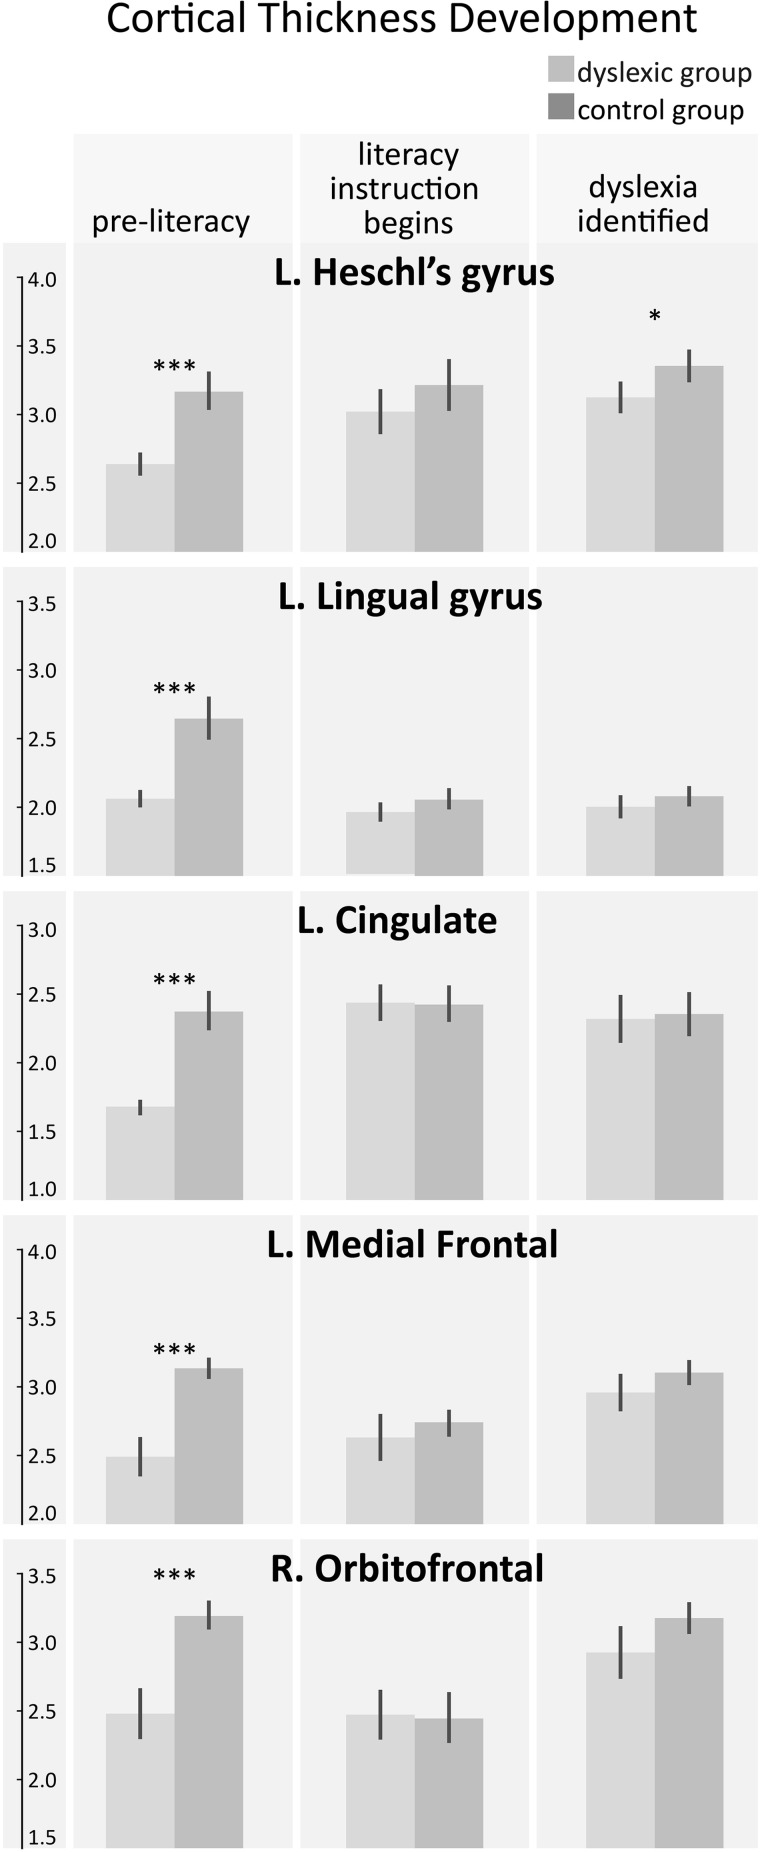
Figure 3.
Developmental trajectories of regions that showed pre-reading differences in cortical thickness. Longitudinal cortical thickness values are shown for the five regions that were different before reading: (A) left Heschl’s gyrus, (B) left lingual, (C) left cingulate, (D) left medial frontal, and (E) right orbitofrontal. The lingual gyrus (B) starts out thicker in the controls and thins over time, while all other regions thicken or stay the same over time. Cross-sectional post hoc t-tests between the two groups are indicated by *P < 0.05, ***P < 0.001.

