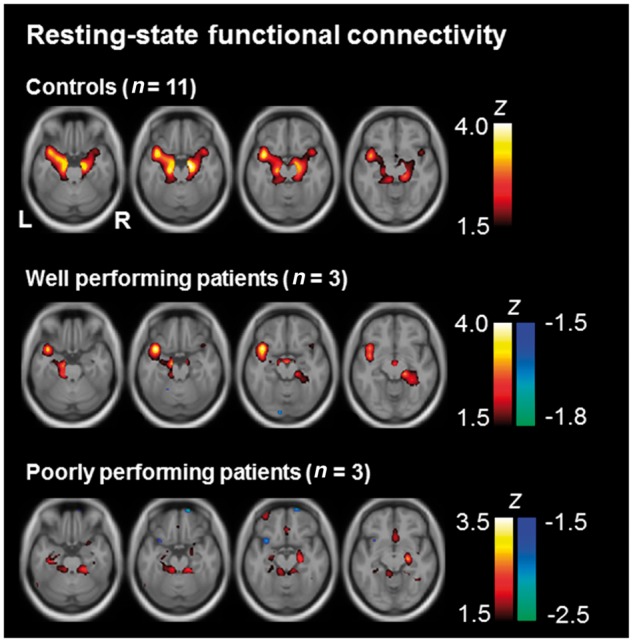
Figure 5.

Resting state functional connectivity. Results of the independent component analyses performed on the resting state functional MRI data are depicted in axial slices at MNI z = −24 to −12 in steps of 4 mm. Independent component analyses were performed separately for each participant. The resulting images reflect the degree to which the component that is most prominent in the hippocampus contributes to the signal in other parts of the brain. Z-transformed images were averaged across groups of interest (controls, n = 11; well performing patients, n = 3; MRI-compatible subgroup of the group of poorly performing patients, n = 3).
