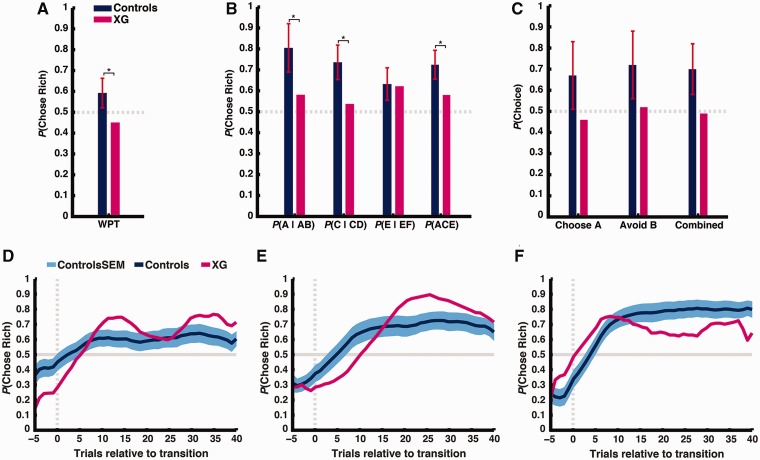
Figure 2.
(A) Patient XG and healthy controls’ performance in the Weather Prediction Task. Plotted is the proportion of times participants chose the more likely option (‘rain’ or ‘shine’) given the cue combination. (B) Patient XG and healthy controls’ performance in the training phase of the Probabilistic Selection Task. Plotted is the proportion of times participants chose the higher rewarded option (A, C and E) from each pair (AB, CD and EF) and across all pairs during the training phase. (C) Patient XG and healthy controls’ performance in the test phase of the Probabilistic Selection Task. Plotted is the proportion of times participants choose A from novel pairs, avoid B from novel pairs, and choose the highest stimulus value across all novel pairs. In A–C, error bars denote standard deviation and asterisks denote P < 0.05. (D, E and F) Patient XG and healthy controls’ performance for Crab Game, Fish Game, and Bait Game, respectively. Plotted is the probability of choosing the richer option across the course of a block (averaging over 16 total blocks per task, representing 14 total transitions). Vertical dashed line denotes block transition. Horizontal line denotes chance performance. Data smoothing kernel = 11.

